Thermodynamic Database
Components (21)
A total of 21 components are included in the database as listed here:
Major alloying elements: Al, Cr, Cu, Fe, Mo, Nb, Ni, Sn, Ta, Ti, V, W and Zr
Minor alloying elements: B, C, H, Hf, Mn, N, O and Si
Suggested Composition Range
The suggested composition range for each element is listed in Table 1. It should be noted that this given composition range is rather conservative. It is derived from the chemistries of the multicomponent commercial alloys that have been used to validate the current database. In the subsystems, many of these elements can be applied to a much wider composition range. In fact, some subsystems are valid in the entire composition range as given in Section Assessed Subsystems
| Elements | Composition Range (wt.%) |
|---|---|
|
Ti |
50-100 |
|
Al, |
0-35 |
|
V |
0-11 |
|
Mo, Nb, Ta, W, Zr |
0-8 |
|
Cr,Sn |
0-5 |
|
Cu, Fe, Ni |
0-3 |
|
B, C, H, N, O, Hf, Mn, Si |
0-0.5 |
Phases
A total of 340 phases are included in the current database. The names and thermodynamic models of some phases are given in Table 2. Information on all phases is listed in PanTi2024: List of Phases. Users can also view it through TDB viewer of Pandat™.
Assessed Subsystems
A total of 231 subsystems, including 180 binary and 51 ternary subsystems have been assessed. The modeling status is indicated by numbers. The systems with number 10 are fully assessed in the whole composition range. The higher value shows higher reliability of the system.
Binary Systems (180)
| Al-B(10) | Al-C(10) | Al-Cr(10) | Al-Cu(10) | Al-Fe(10) | Al-Mn(10) |
| Al-Mo(10) | Al-Nb(10) | Al-Ni(10) | Al-O(10) | Al-Si(10) | Al-Sn(10) |
| Al-Ta(10) | Al-Ti(10) | Al-V(10) | Al-W(10) | Al-Zr(10) | B-C(10) |
| B-Cr(10) | B-Cu(10) | B-Fe(10) | B-Mn(10) | B-Mo(10) | B-Nb(10) |
| B-Ni(10) | B-Si(10) | B-Sn(10) | B-Ta(10) | B-Ti(10) | B-V(10) |
| B-W(10) | B-Zr(10) | C-Cr(10) | C-Cu(10) | C-Fe(10) | C-Mn(10) |
| C-Mo(10) | C-Nb(10) | C-Ni(10) | C-Si(10) | C-Ta(10) | C-Ti(10) |
| C-V(10) | C-W(10) | C-Zr(10) | Cr-Cu(10) | Cr-Fe(10) | Cr-Mn(10) |
| Cr-Mo(10) | Cr-N(10) | Cr-Nb(10) | Cr-Ni(10) | Cr-O(10) | Cr-Si(10) |
| Cr-Sn(10) | Cr-Ta(10) | Cr-Ti(10) | Cr-V(10) | Cr-W(10) | Cr-Zr(10) |
| Cu-Fe(10) | Cu-Mn(10) | Cu-Mo(10) | Cu-Nb(10) | Cu-Ni(10) | Cu-O(10) |
| Cu-Si(10) | Cu-Sn(10) | Cu-Ta(10) | Cu-Ti(10) | Cu-V(10) | Cu-W(10) |
| Cu-Zr(10) | Fe-Mn(10) | Fe-Mo(10) | Fe-Nb(10) | Fe-Ni(10) | Fe-O(10) |
| Fe-Si(10) | Fe-Sn(10) | Fe-Ta(10) | Fe-Ti(10) | Fe-V(10) | Fe-W(10) |
| Fe-Zr(10) | H-Ti(10) | H-Zr(10) | Hf-O(10) | Hf-Ta(10) | Hf-Ti(10) |
| Hf-Nb(10) | Mn-Mo(10) | Mn-Nb(10) | Mn-Ni(10) | Mn-O(10) | Mn-Si(10) |
| Mn-Sn(10) | Mn-Ta(10) | Mn-Ti(10) | Mn-V(10) | Mn-Zr(10) | Mo-Nb(10) |
| Mo-Ni(10) | Mo-O(10) | Mo-Si(10) | Mo-Sn(10) | Mo-Ta(10) | Mo-Ti(10) |
| Mo-V(10) | Mo-Zr(10) | Nb-Ni(10) | Nb-O(10) | Nb-Si(10) | Nb-Sn(10) |
| Nb-Ti(10) | Nb-V(10) | Nb-W(10) | Nb-Zr(10) | Ni-O(10) | Ni-Si(10) |
| Ni-Sn(10) | Ni-Ta(10) | Ni-Ti(10) | Ni-V(10) | Ni-W(10) | Ni-Zr(10) |
| O-Si(10) | O-Sn(10) | O-Ta(10) | O-W(10) | O-Zr(10) | Si-Sn(10) |
| Si-Ta(10) | Si-Ti(10) | Si-V(10) | Si-W(10) | Si-Zr(10) | Sn-Ti(10) |
| Sn-V(10) | Sn-Zr(10) | Ta-Ti(10) | Ta-V(10) | Ta-W(10) | Ta-Zr(10) |
| Ti-V(10) | Ti-W(10) | Ti-Zr(10) | V-W(10) | V-Zr(10) | W-Zr(10) |
| Al-H(8) | Al-N(8) | H-Nb(8) | H-V(8) | Mn-N(8) | Mo-N(8) |
| N-Nb(8) | N-Ni(8) | N-Si(8) | N-Sn(8) | N-Ta(8) | N-Ti(8) |
| N-V(8) | N-Zr(8) | O-Ti(8) | O-V(8) | Cr-H(6) | Cu-H(6) |
| Cu-N(6) | Fe-H(6) | Fe-N(6) | H-Mn(6) | H-Mo(6) | H-Ni(6) |
| H-Si(6) | H-Sn(6) | H-Ta(6) | H-W(6) | B-Hf(0) | C-Hf(0) |
Ternary Systems (51)
| Al-Cr-Ti(10) | Al-Fe-Ti(10) | Al-Mn-Ti(10) | Al-Mo-Ti(10) | Al-Nb-Ti(10) | Al-Ni-Ti(10) |
| Al-Si-Ti(10) | Al-Ti-V(10) | Al-Ti-Zr(10) | Al-Cr-Nb(10) | Cr-Mn-Ti(10) | Al-Sn-Ti(8) |
| Cr-Fe-Ti(8) | Cr-Ti-V(8) | Nb-Ti-Zr(8) | Al-C-Ti(6) | Al-H-Ti(6) | Al-N-Ti(6) |
| Al-O-Ti(6) | C-Cr-Ti(6) | Cr-H-Ti(6) | Cr-N-Ti(6) | Cr-O-Ti(6) | C-Fe-Ti(6) |
| Fe-H-Ti(6) | Fe-N-Ti(6) | Fe-O-Ti(6) | C-Mn-Ti(6) | H-Mn-Ti(6) | Mn-N-Ti(6) |
| Mn-O-Ti(6) | C-Mo-Ti(6) | H-Mo-Ti(6) | Mo-N-Ti(6) | Mo-O-Ti(6) | C-Nb-Ti(6) |
| H-Nb-Ti(6) | N-Nb-Ti(6) | Nb-O-Ti(6) | C-Ni-Ti(6) | H-Ni-Ti(6) | N-Ni-Ti(6) |
| Ni-O-Ti(6) | C-Si-Ti(6) | H-Si-Ti(6) | N-Si-Ti(6) | O-Si-Ti(6) | C-Ti-V(6) |
| H-Ti-V(6) | N-Ti-V(6) | O-Ti-V(6) |
Database Validation
Since this database has been designed for use with conventional a-b types of titanium alloys, it has been focused at the Ti-rich corner. This database has been tested by a large number of a-b type of titanium alloys, such as Ti64, Ti6242 and Ti6246. Table 3 lists the alloys and references used for validating the current database. The suggested composition ranges given in Table 1 are based on the compositions of these testing alloys. Users need to be careful while using the database beyond the suggested ranges.
This database can be used to calculate phase equilibria for multi-component alloys, such as equilibrium between a and b. It can be used to predict phase transformation temperatures, such as b-transus. The fraction of each phase as a function of temperature, partitioning of components in different phases can also be calculated. In addition to equilibrium calculations, Scheil simulations can also be carried out using this database. Some calculated examples are given below.
Beta transus, the temperature at which a starts to form from b, is an important reference parameter in the selection of processing conditions, such as heat treatment process, for the conventional a-b type of titanium alloys. This temperature has been calculated for a large number of Ti64 and other titanium alloys using the current database. Figure 1 shows a comparison between the predicted and observed beta transus temperatures for more than 150 Ti64 heats, reasonable agreement is obtained. The accuracy of the prediction depends on the reliability of the database and the accuracy of the input chemistry of the alloy. The calculated beta transus temperature is found to be very sensitive to the amount of the interstitial elements, such as C, H, N, and O. It is seen from Figure 1 that the predicted beta transus temperatures are in agreement with the observed ones. Figure 2 shows a similar comparison for other titanium alloys, including Ti662, Ti6242, Ti6246, Ti17 and so on, and reasonable agreement is obtained.
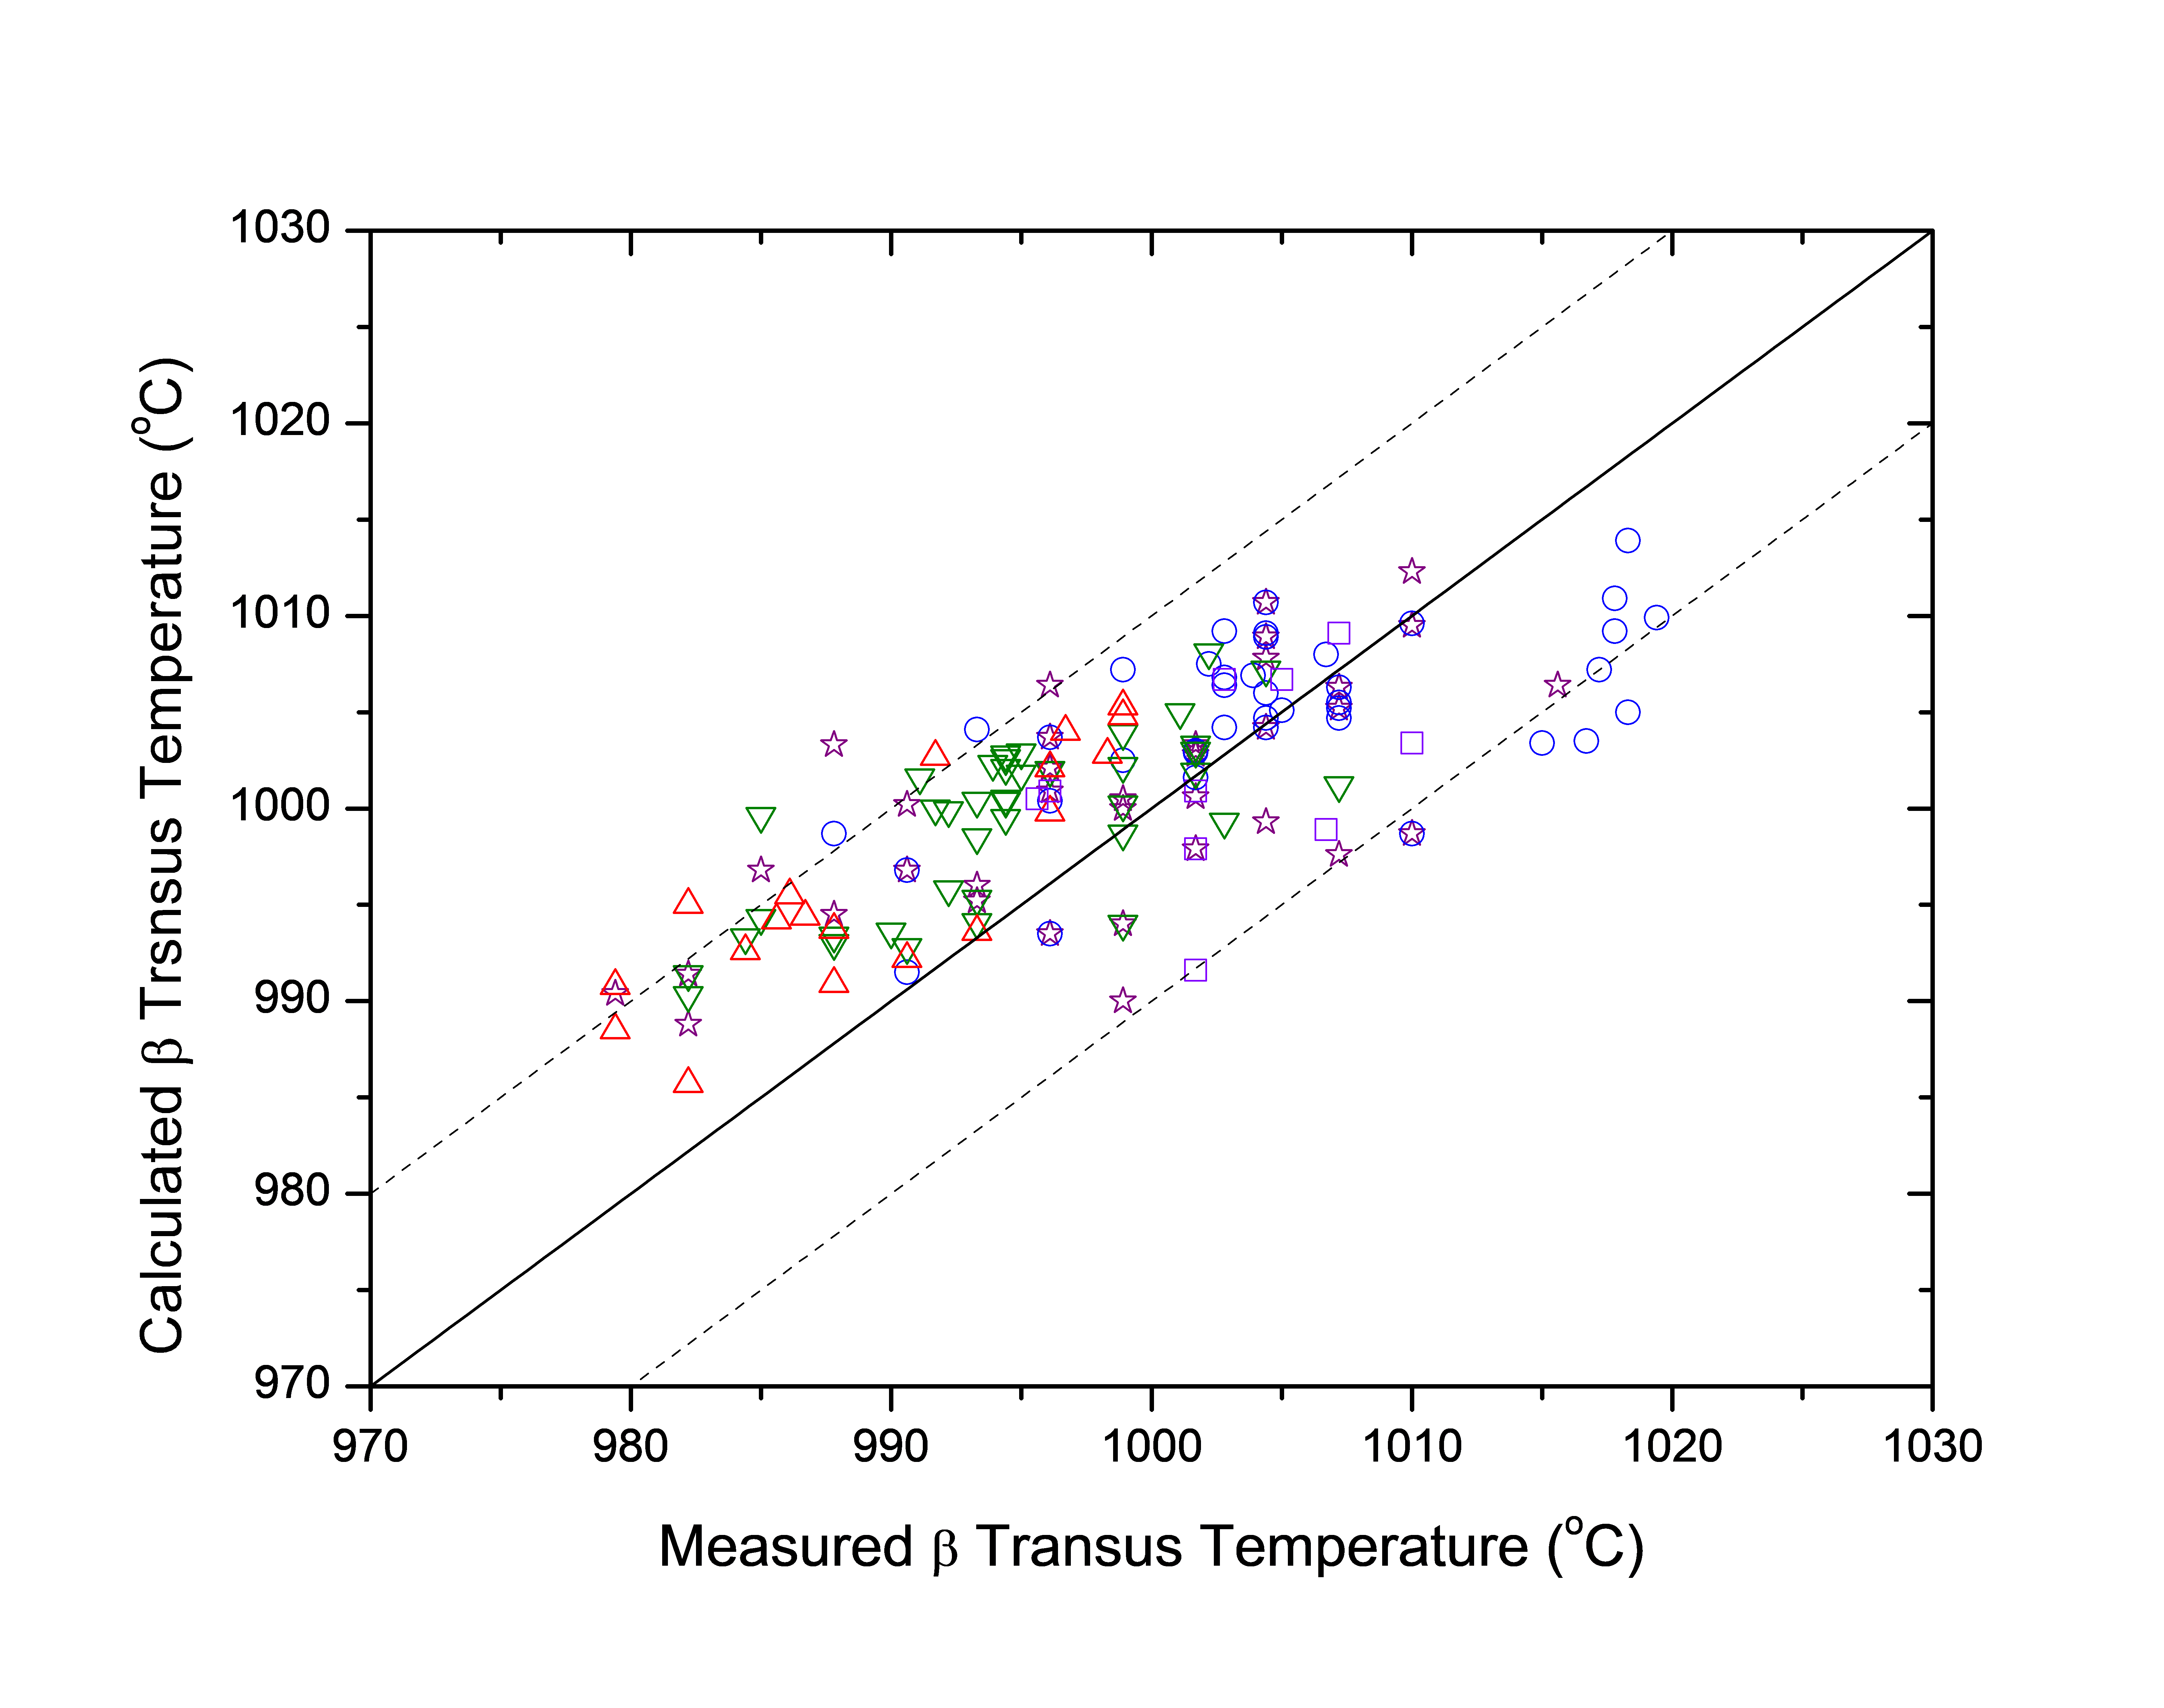
Figure 1: Comparison between the predicted and observed beta transus for more than 150 Ti64 heats. The calculated transformation temperatures correspond to 0% of a phase formed and the experimental data are from [1966Cas, 2003Sem, 2003Fur]
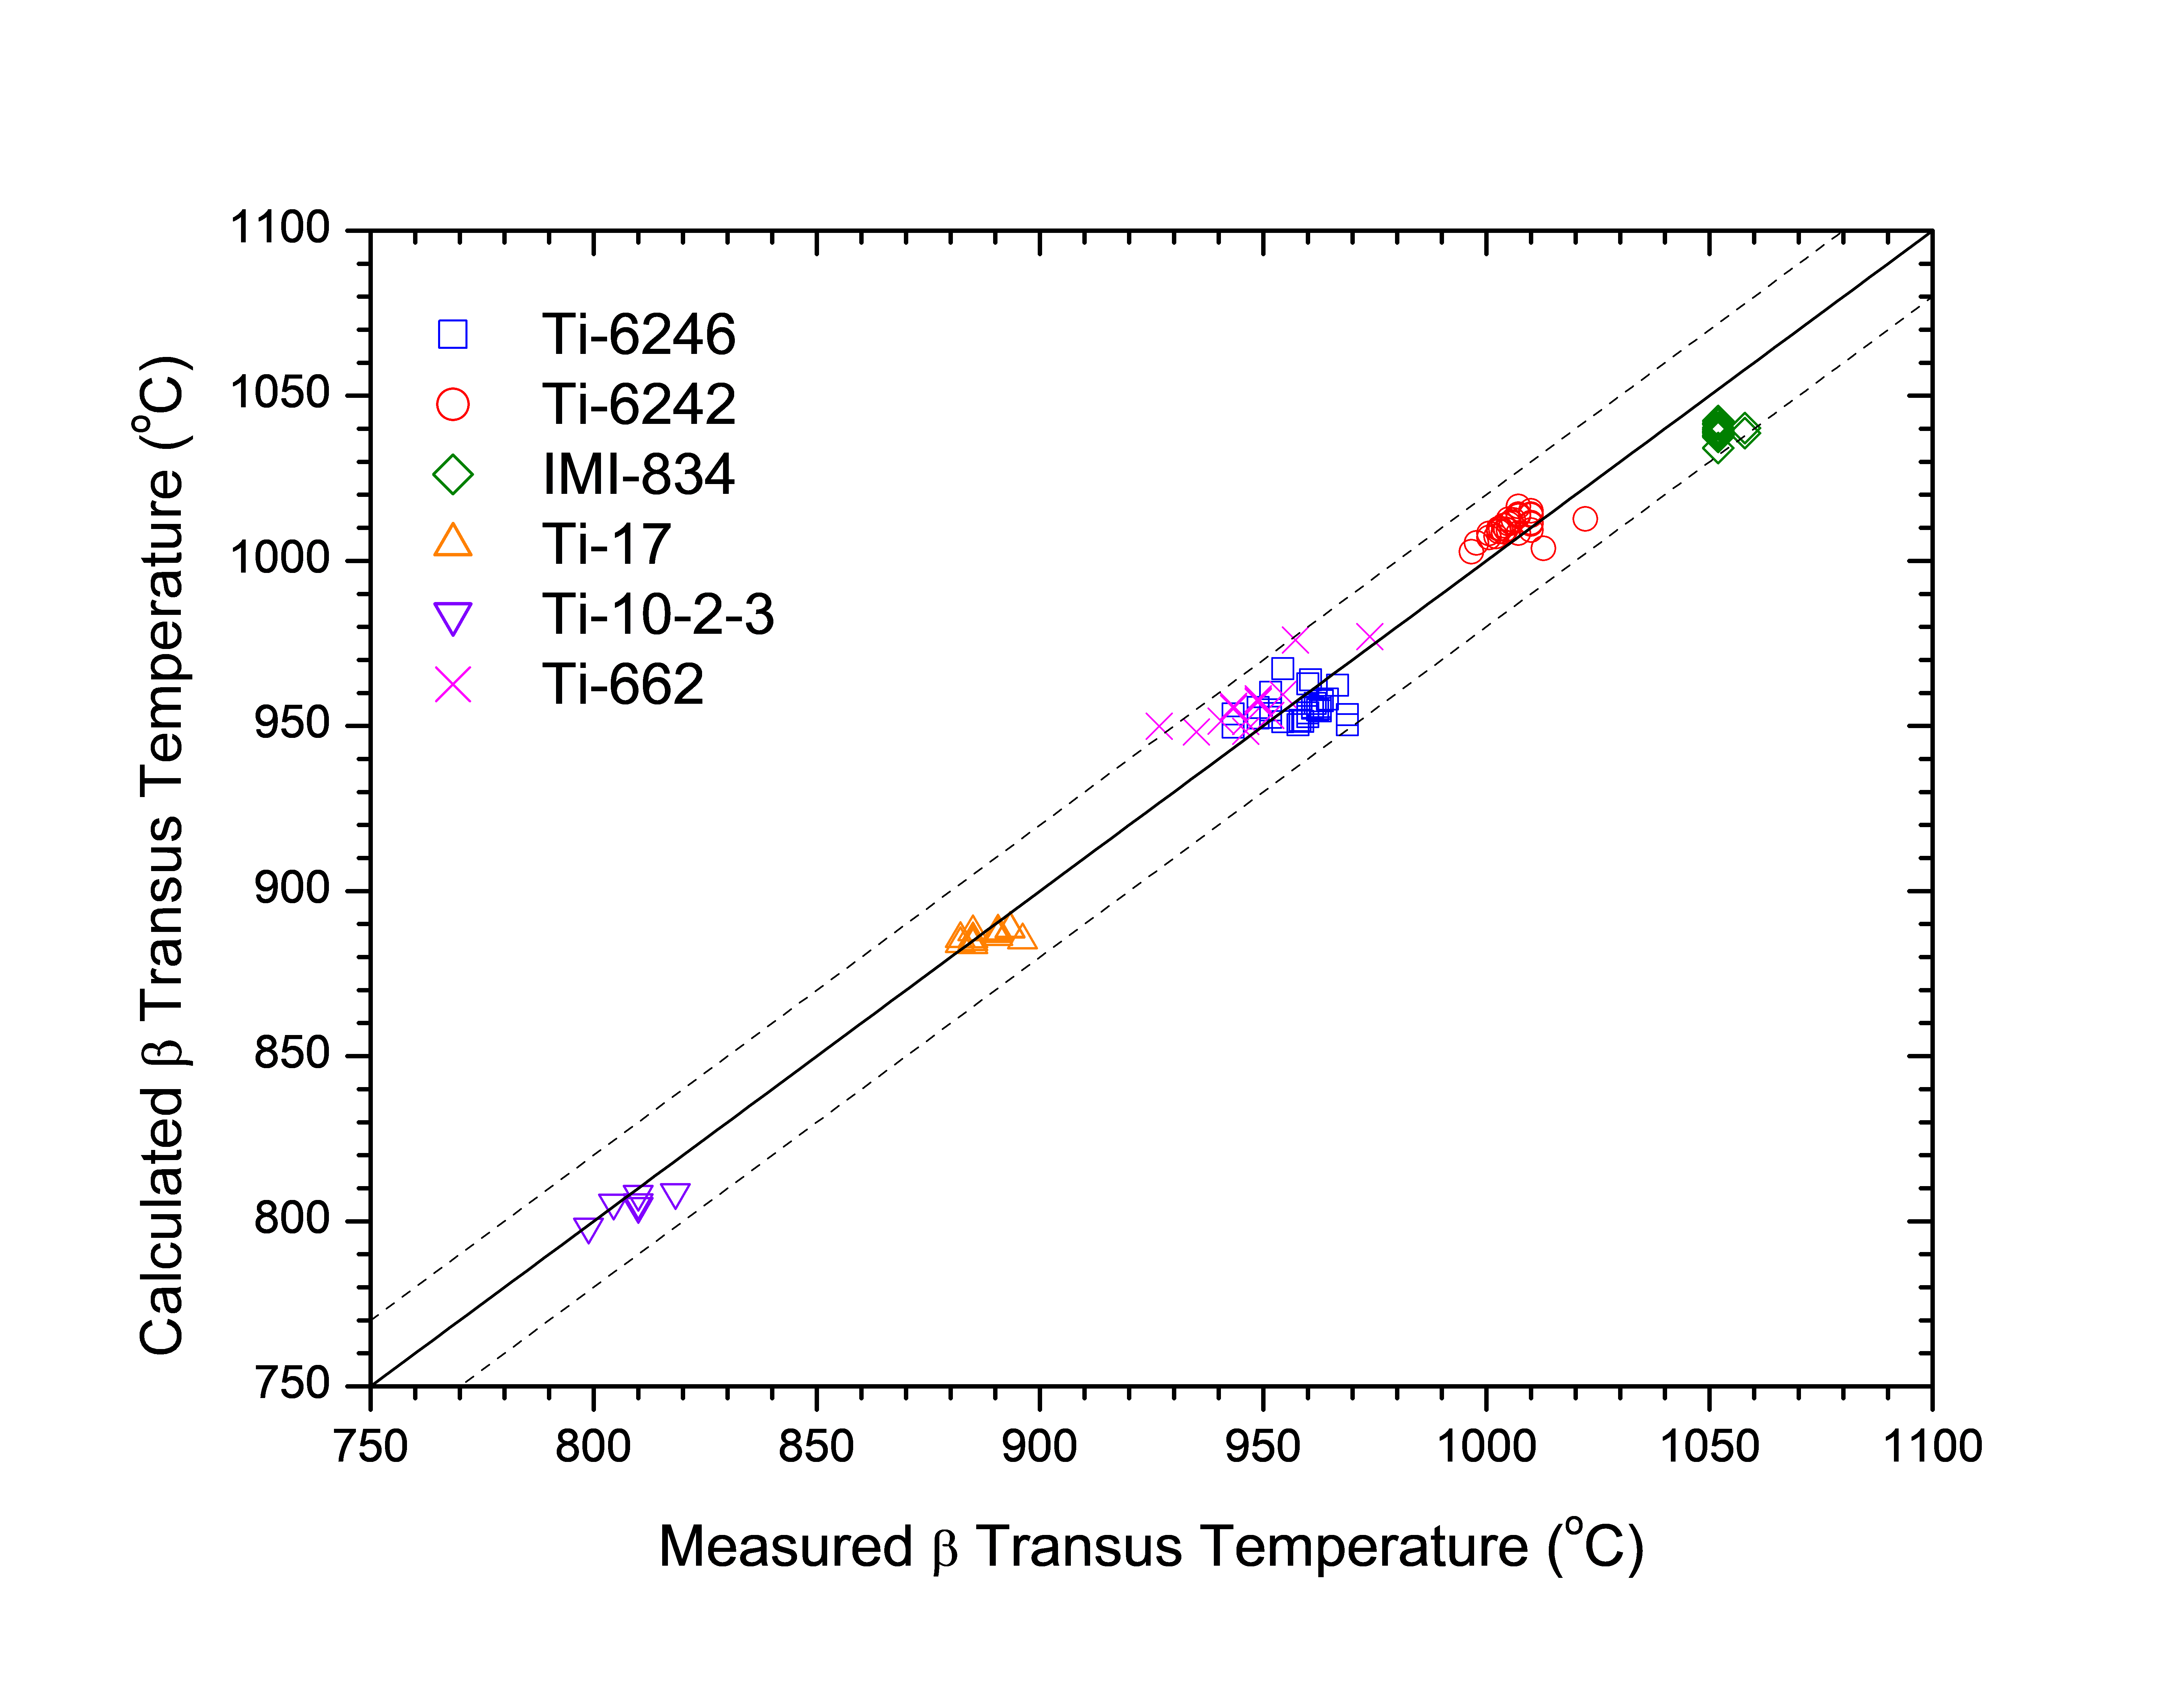
Figure 2: Comparison between the predicted and observed beta transus for other titanium alloys. The calculated transformation temperatures correspond to 0% of a phase formed
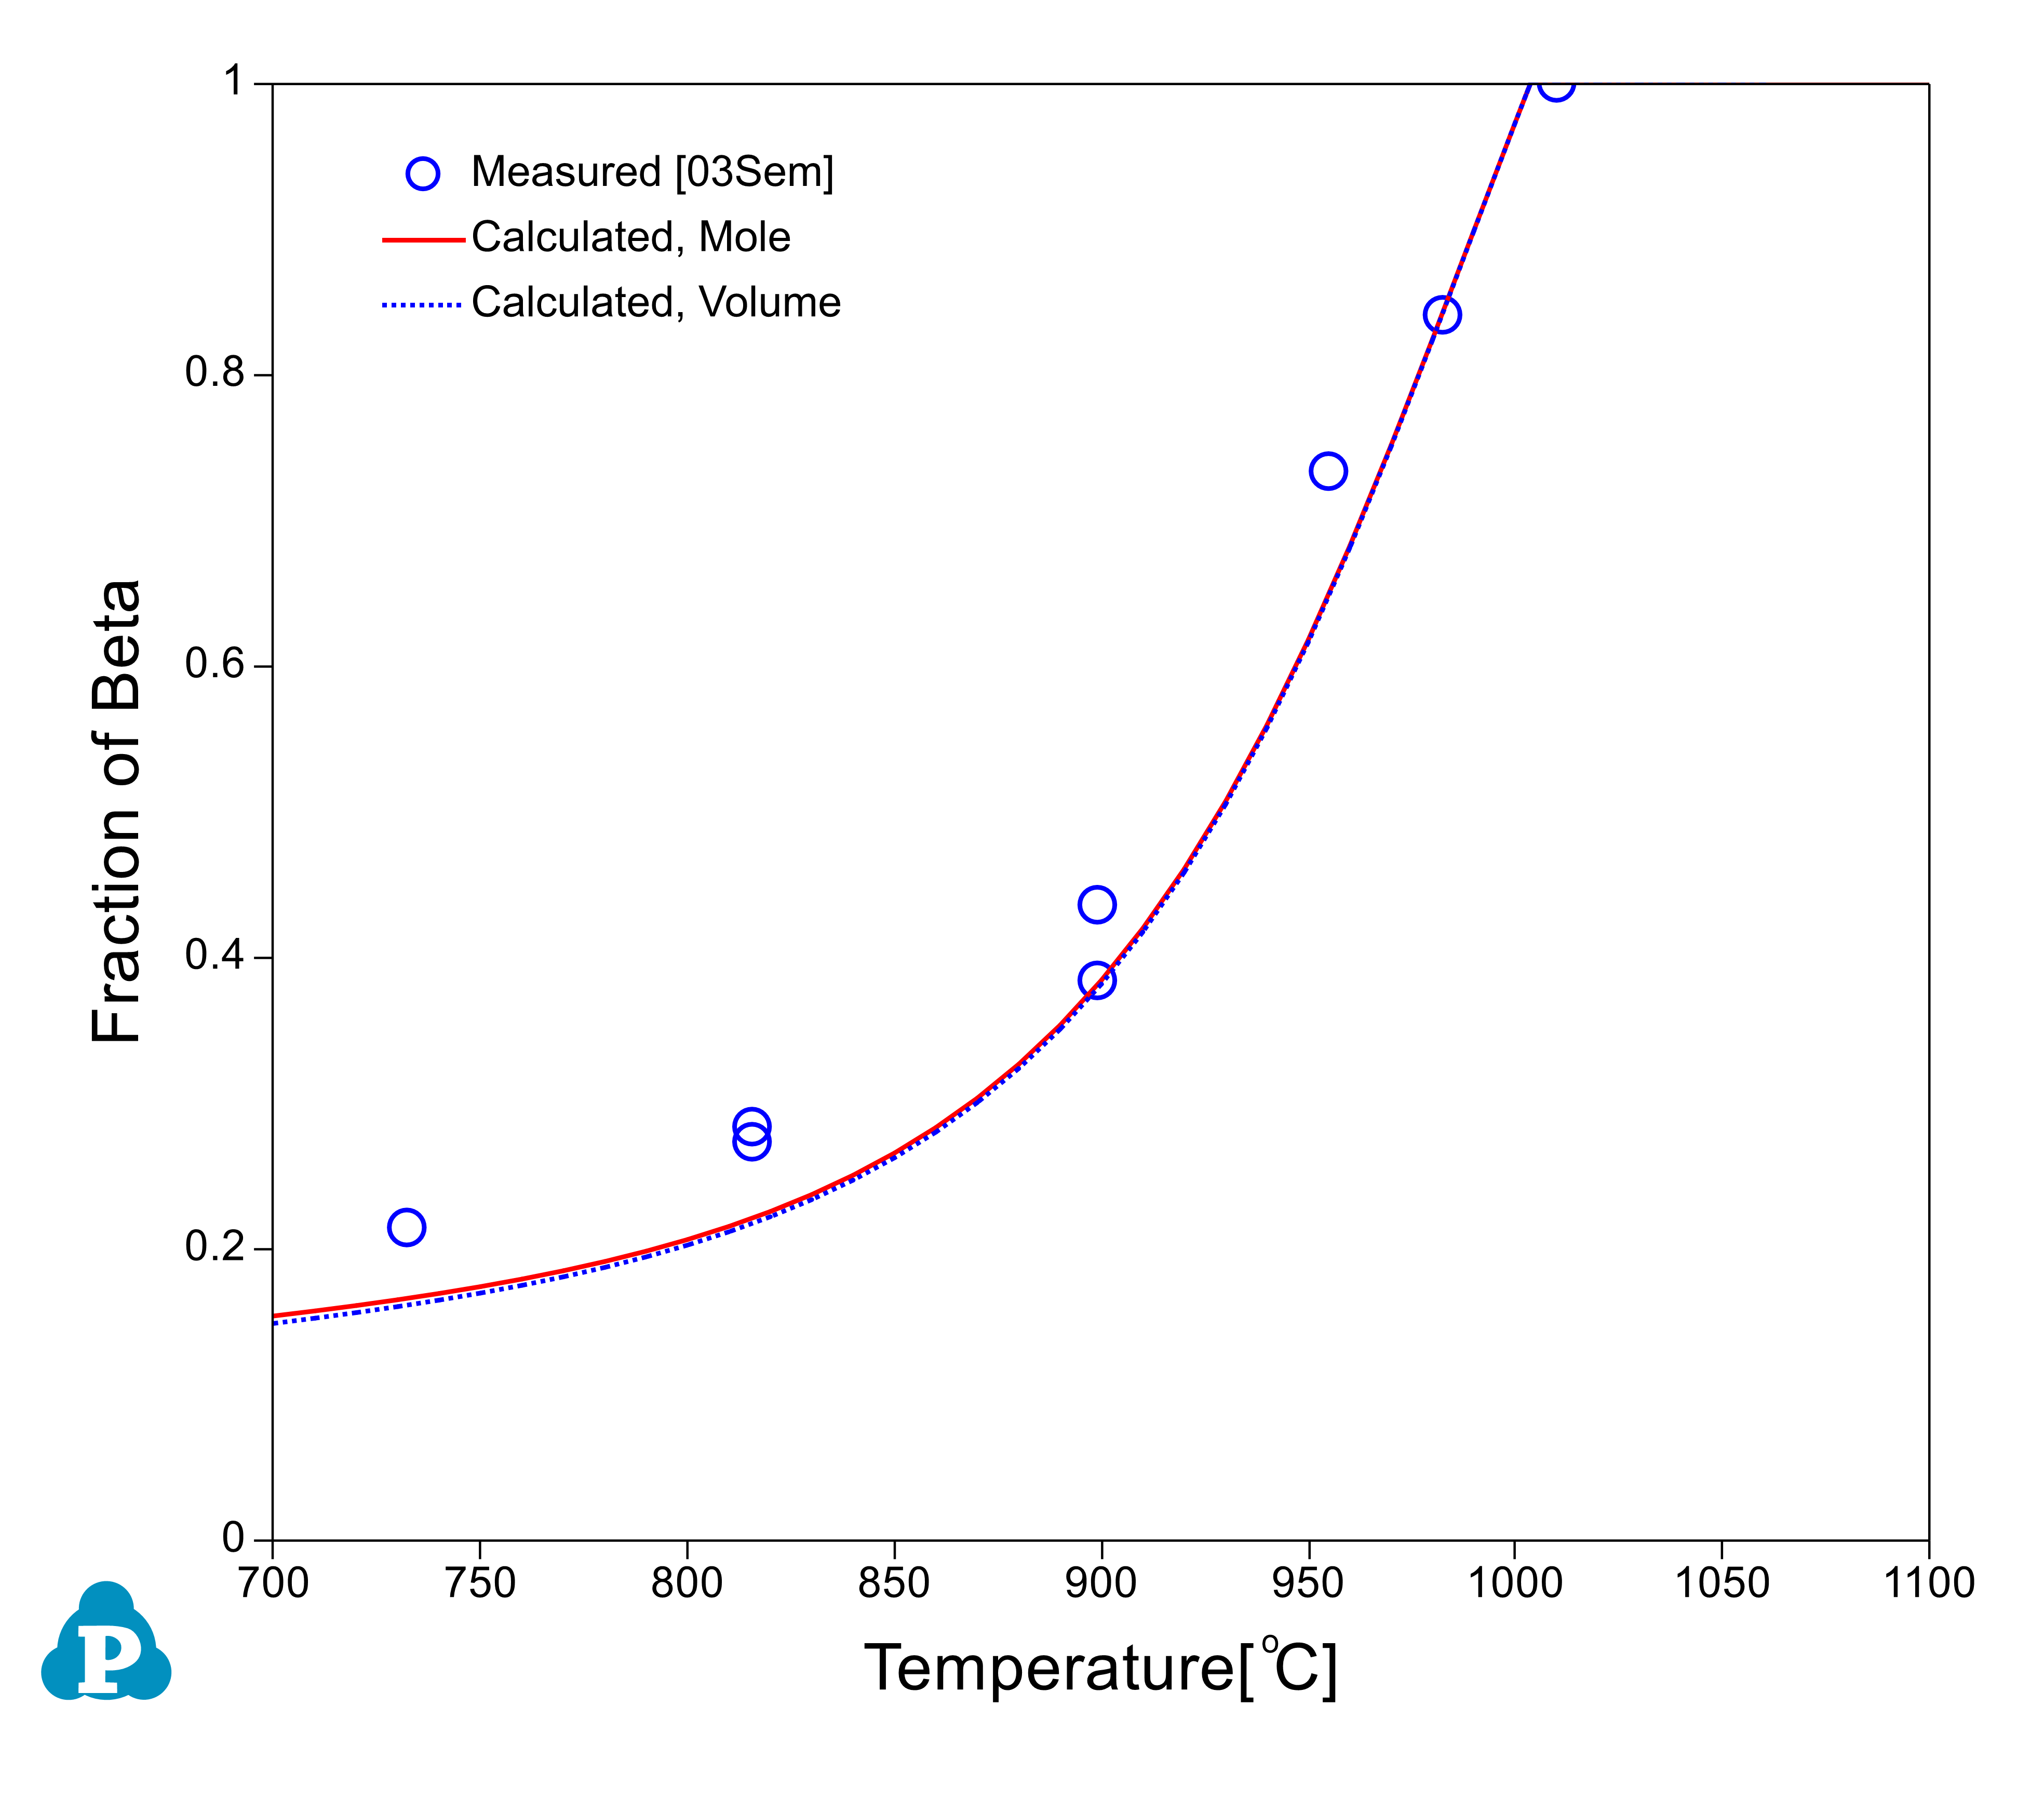
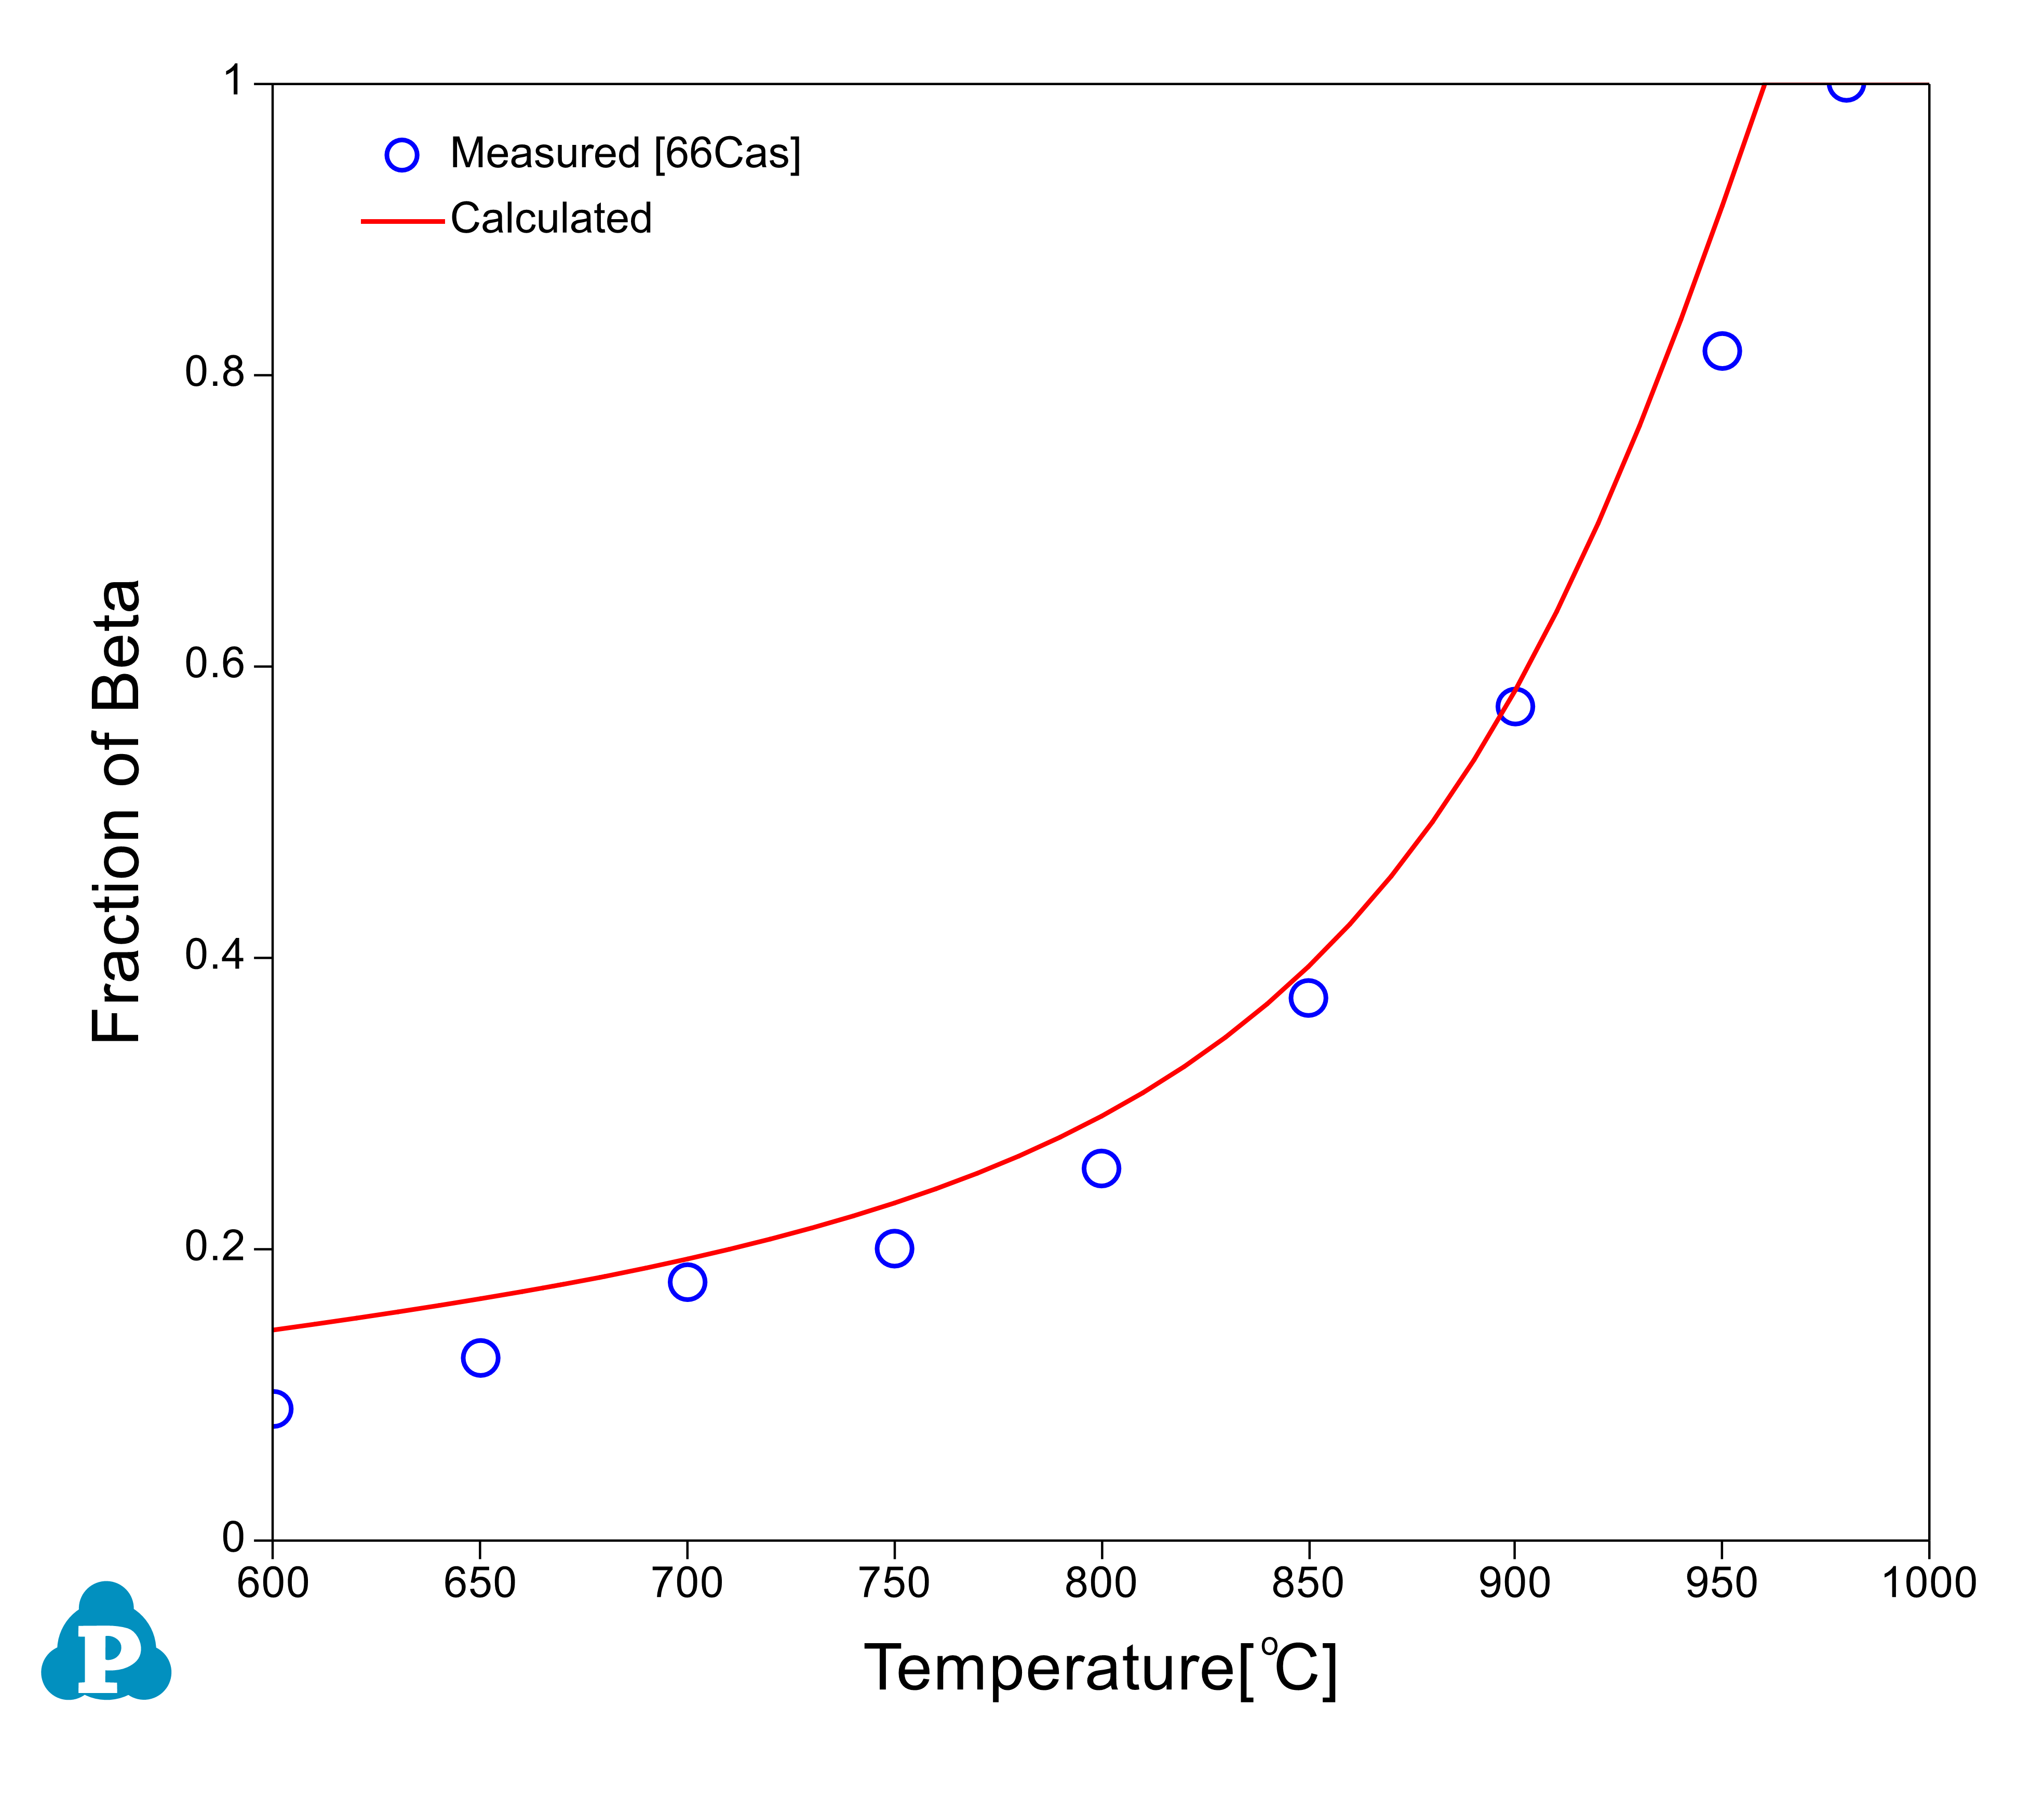
The relative amounts of a and b phases are critical in the determination of alloy properties for an a-b alloy. Beta approach curve, the volume fraction of beta phase as a function of temperature, is therefore important in the selection of final heat treatment temperature. Beta approach curves for two Ti64 heats are calculated as plotted in Figure 3 and Figure 4. The experimental data [2003Sem, 1966Cas] are also plotted on the diagrams for comparison; very good agreements are obtained.
It should point out that the calculated phase fractions are mole fractions, while the measured values are volume fractions. However, since the molar volume of the a phase is very close to that of the b phase, the error induced due to the direct comparison between them is small. This can be seen in Figure 3 in which both the mole factions and the volume fractions of b phase are plotted.
In addition to Ti64, beta approach curves are also calculated for other titanium alloys. Figure 5 shows the beta approach curve for one Ti6242 alloy, and the experimental data are from Semiatin [2005Sem].
Equilibrium phase compositions are useful in understanding the partitioning of elements in different phases. These are calculated and compared with the experimental measurements for Ti64 and Ti6242 alloys. Figure 6 shows the equilibrium compositions of Al and V in a and b for one Ti64 alloy. In general, the calculated equilibrium compositions agree with the experimental data very well. The calculated Al concentrations in the b phase are higher than the measurements at low temperatures. This is due to the fact that the b grains were too small to allow an accurate analysis [1979Las]. Figure 7 shows the equilibrium compositions of Al and Mo in a and b for the Ti6242 alloy.
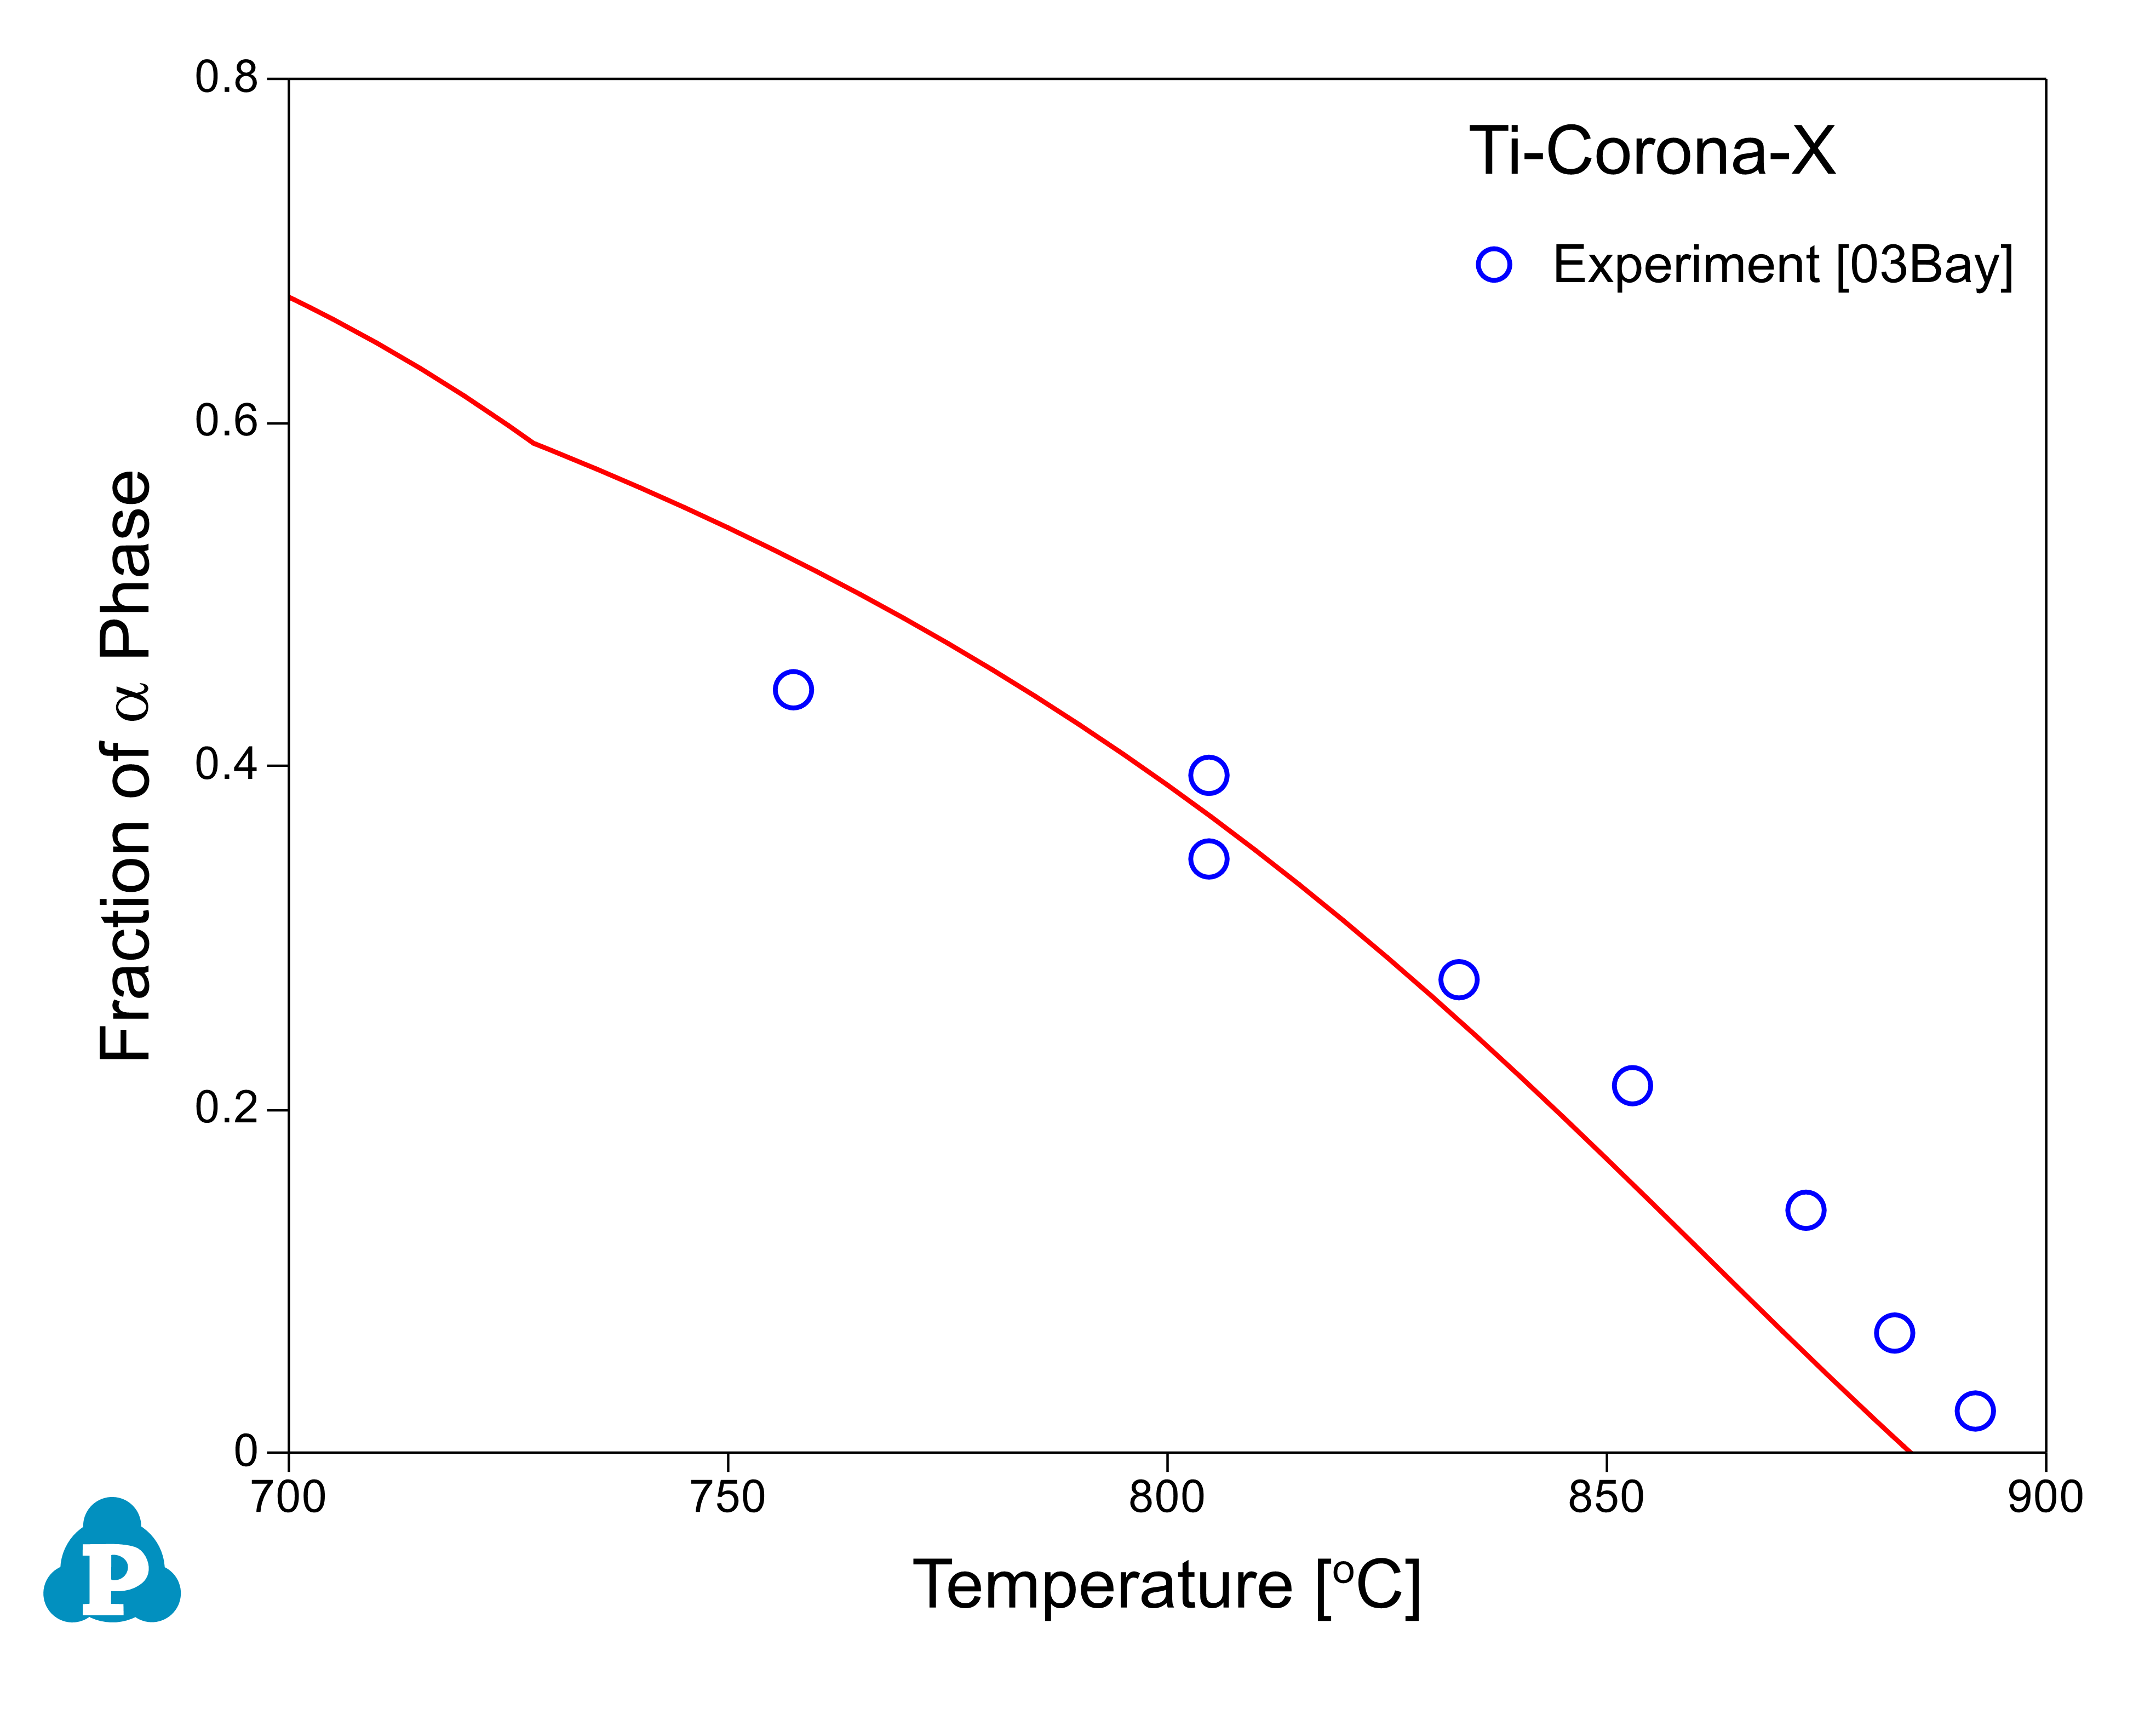
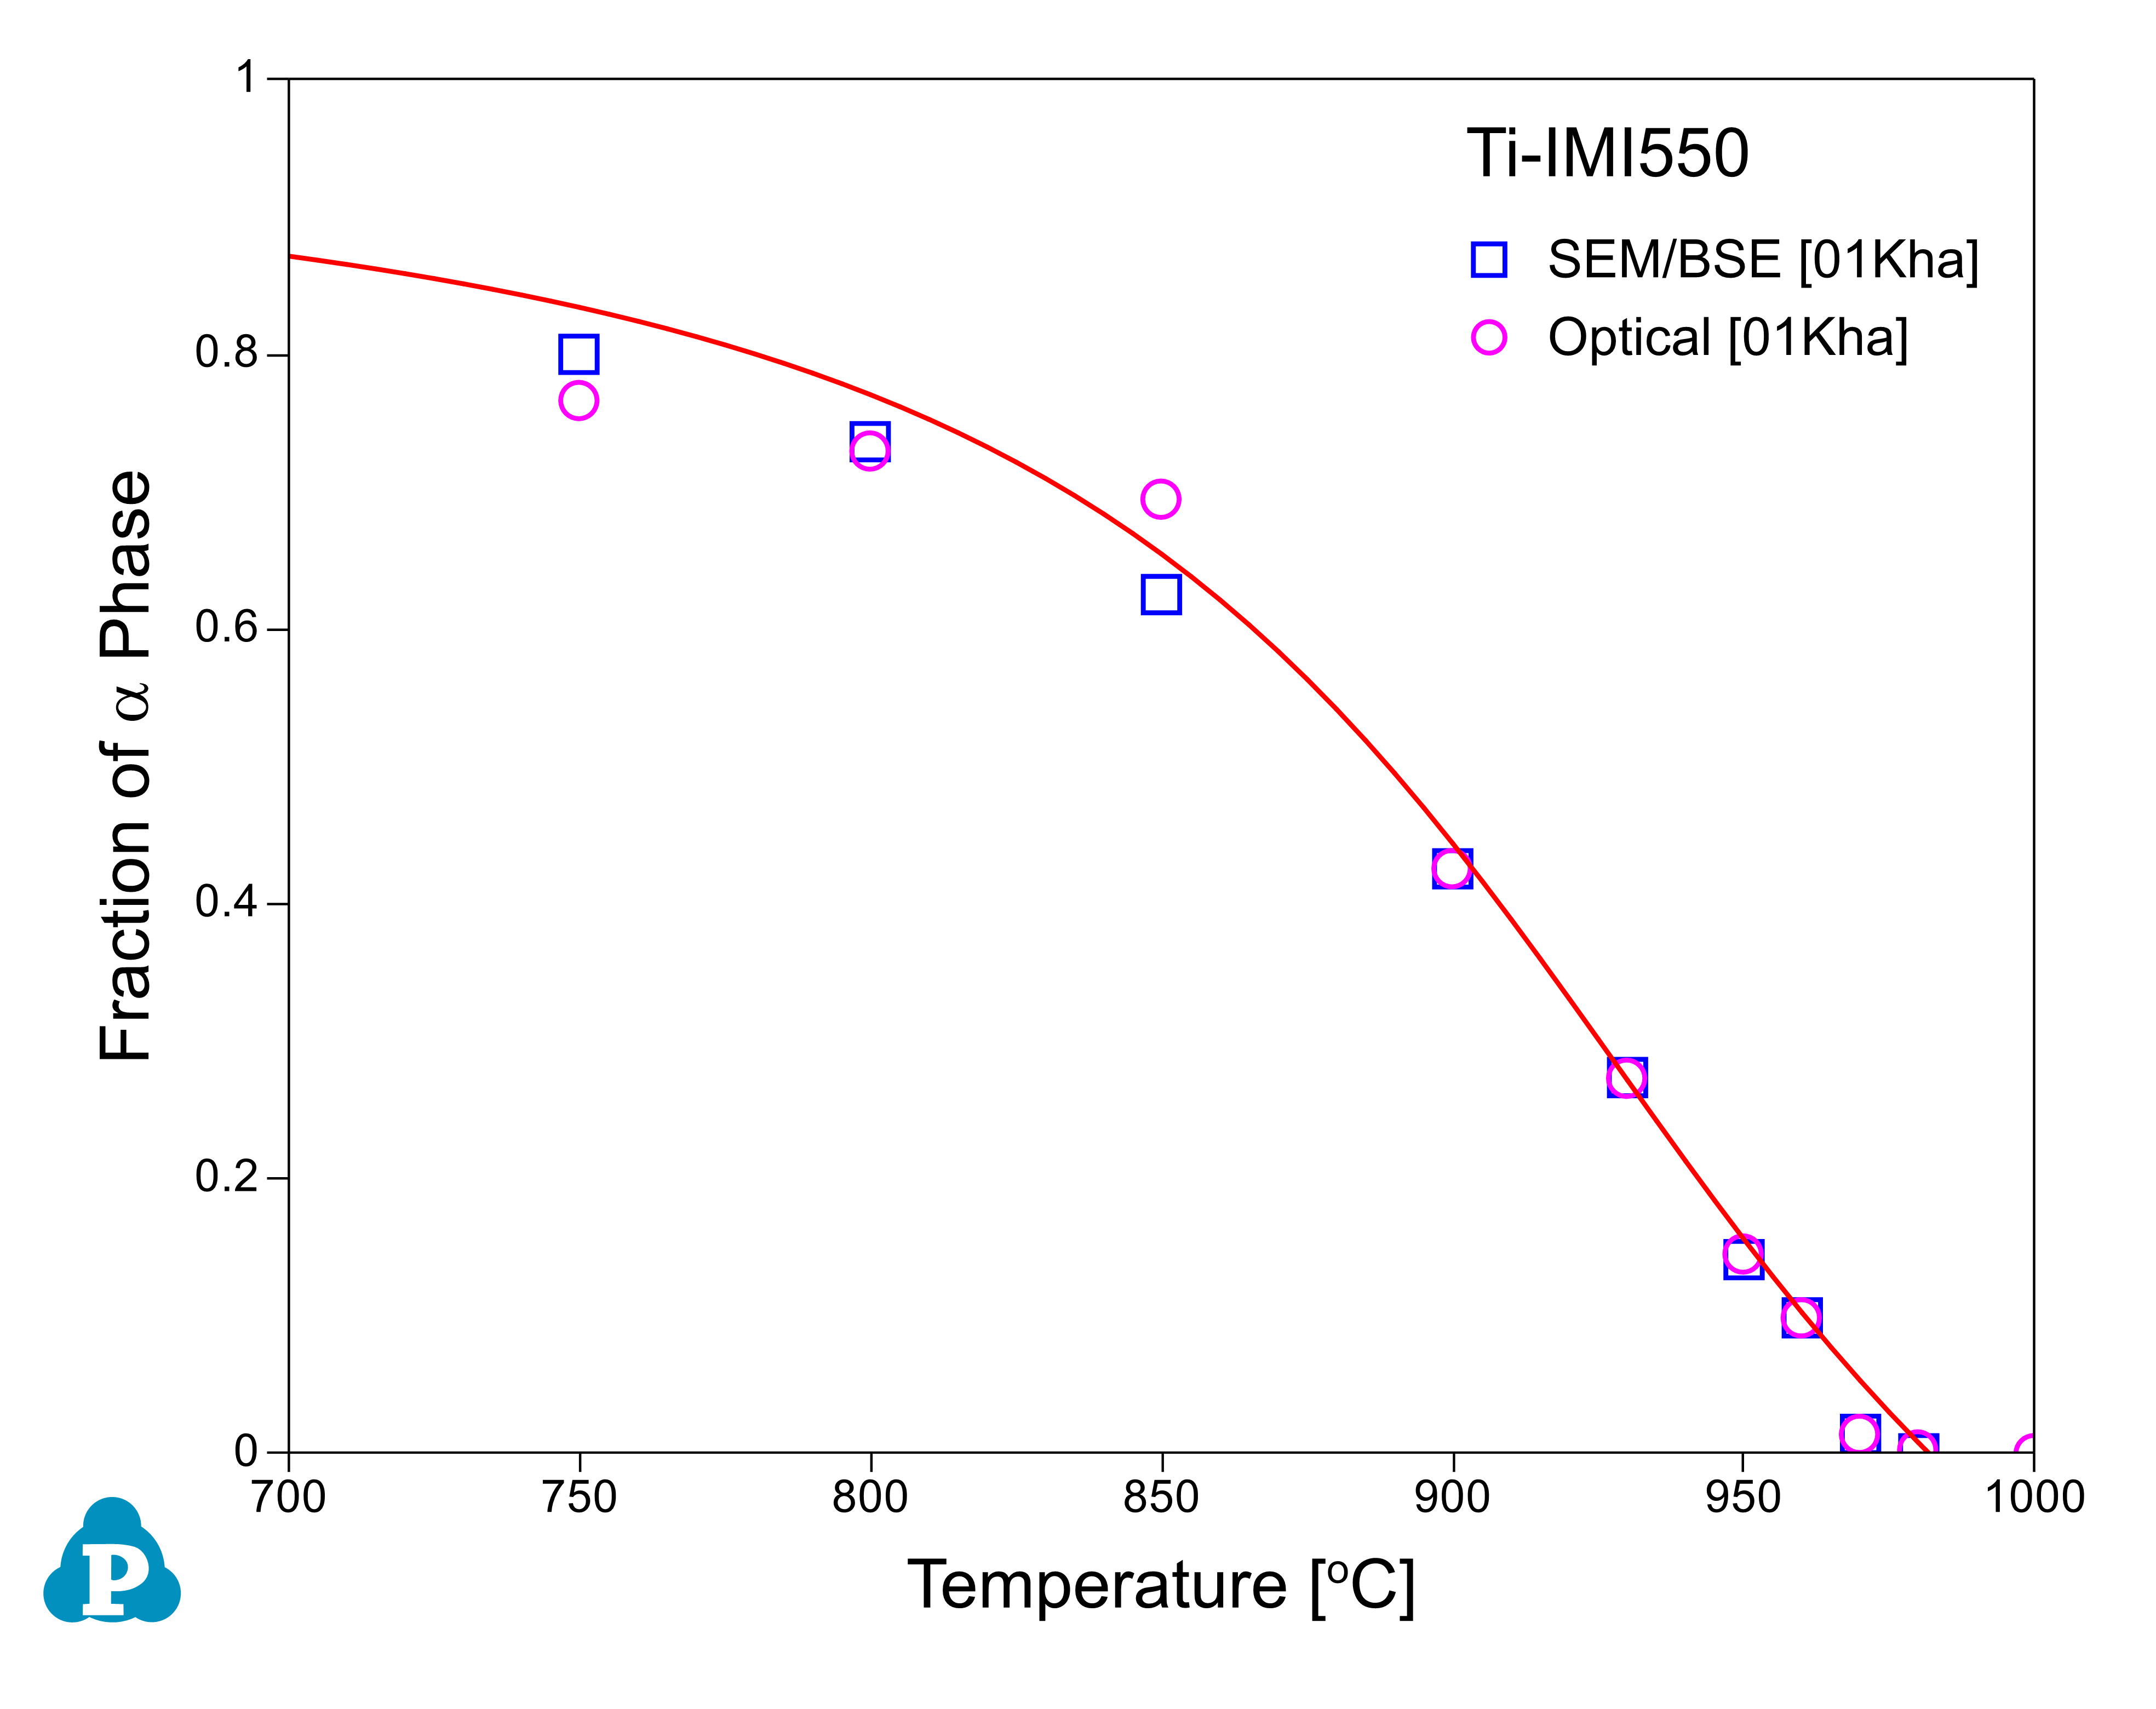
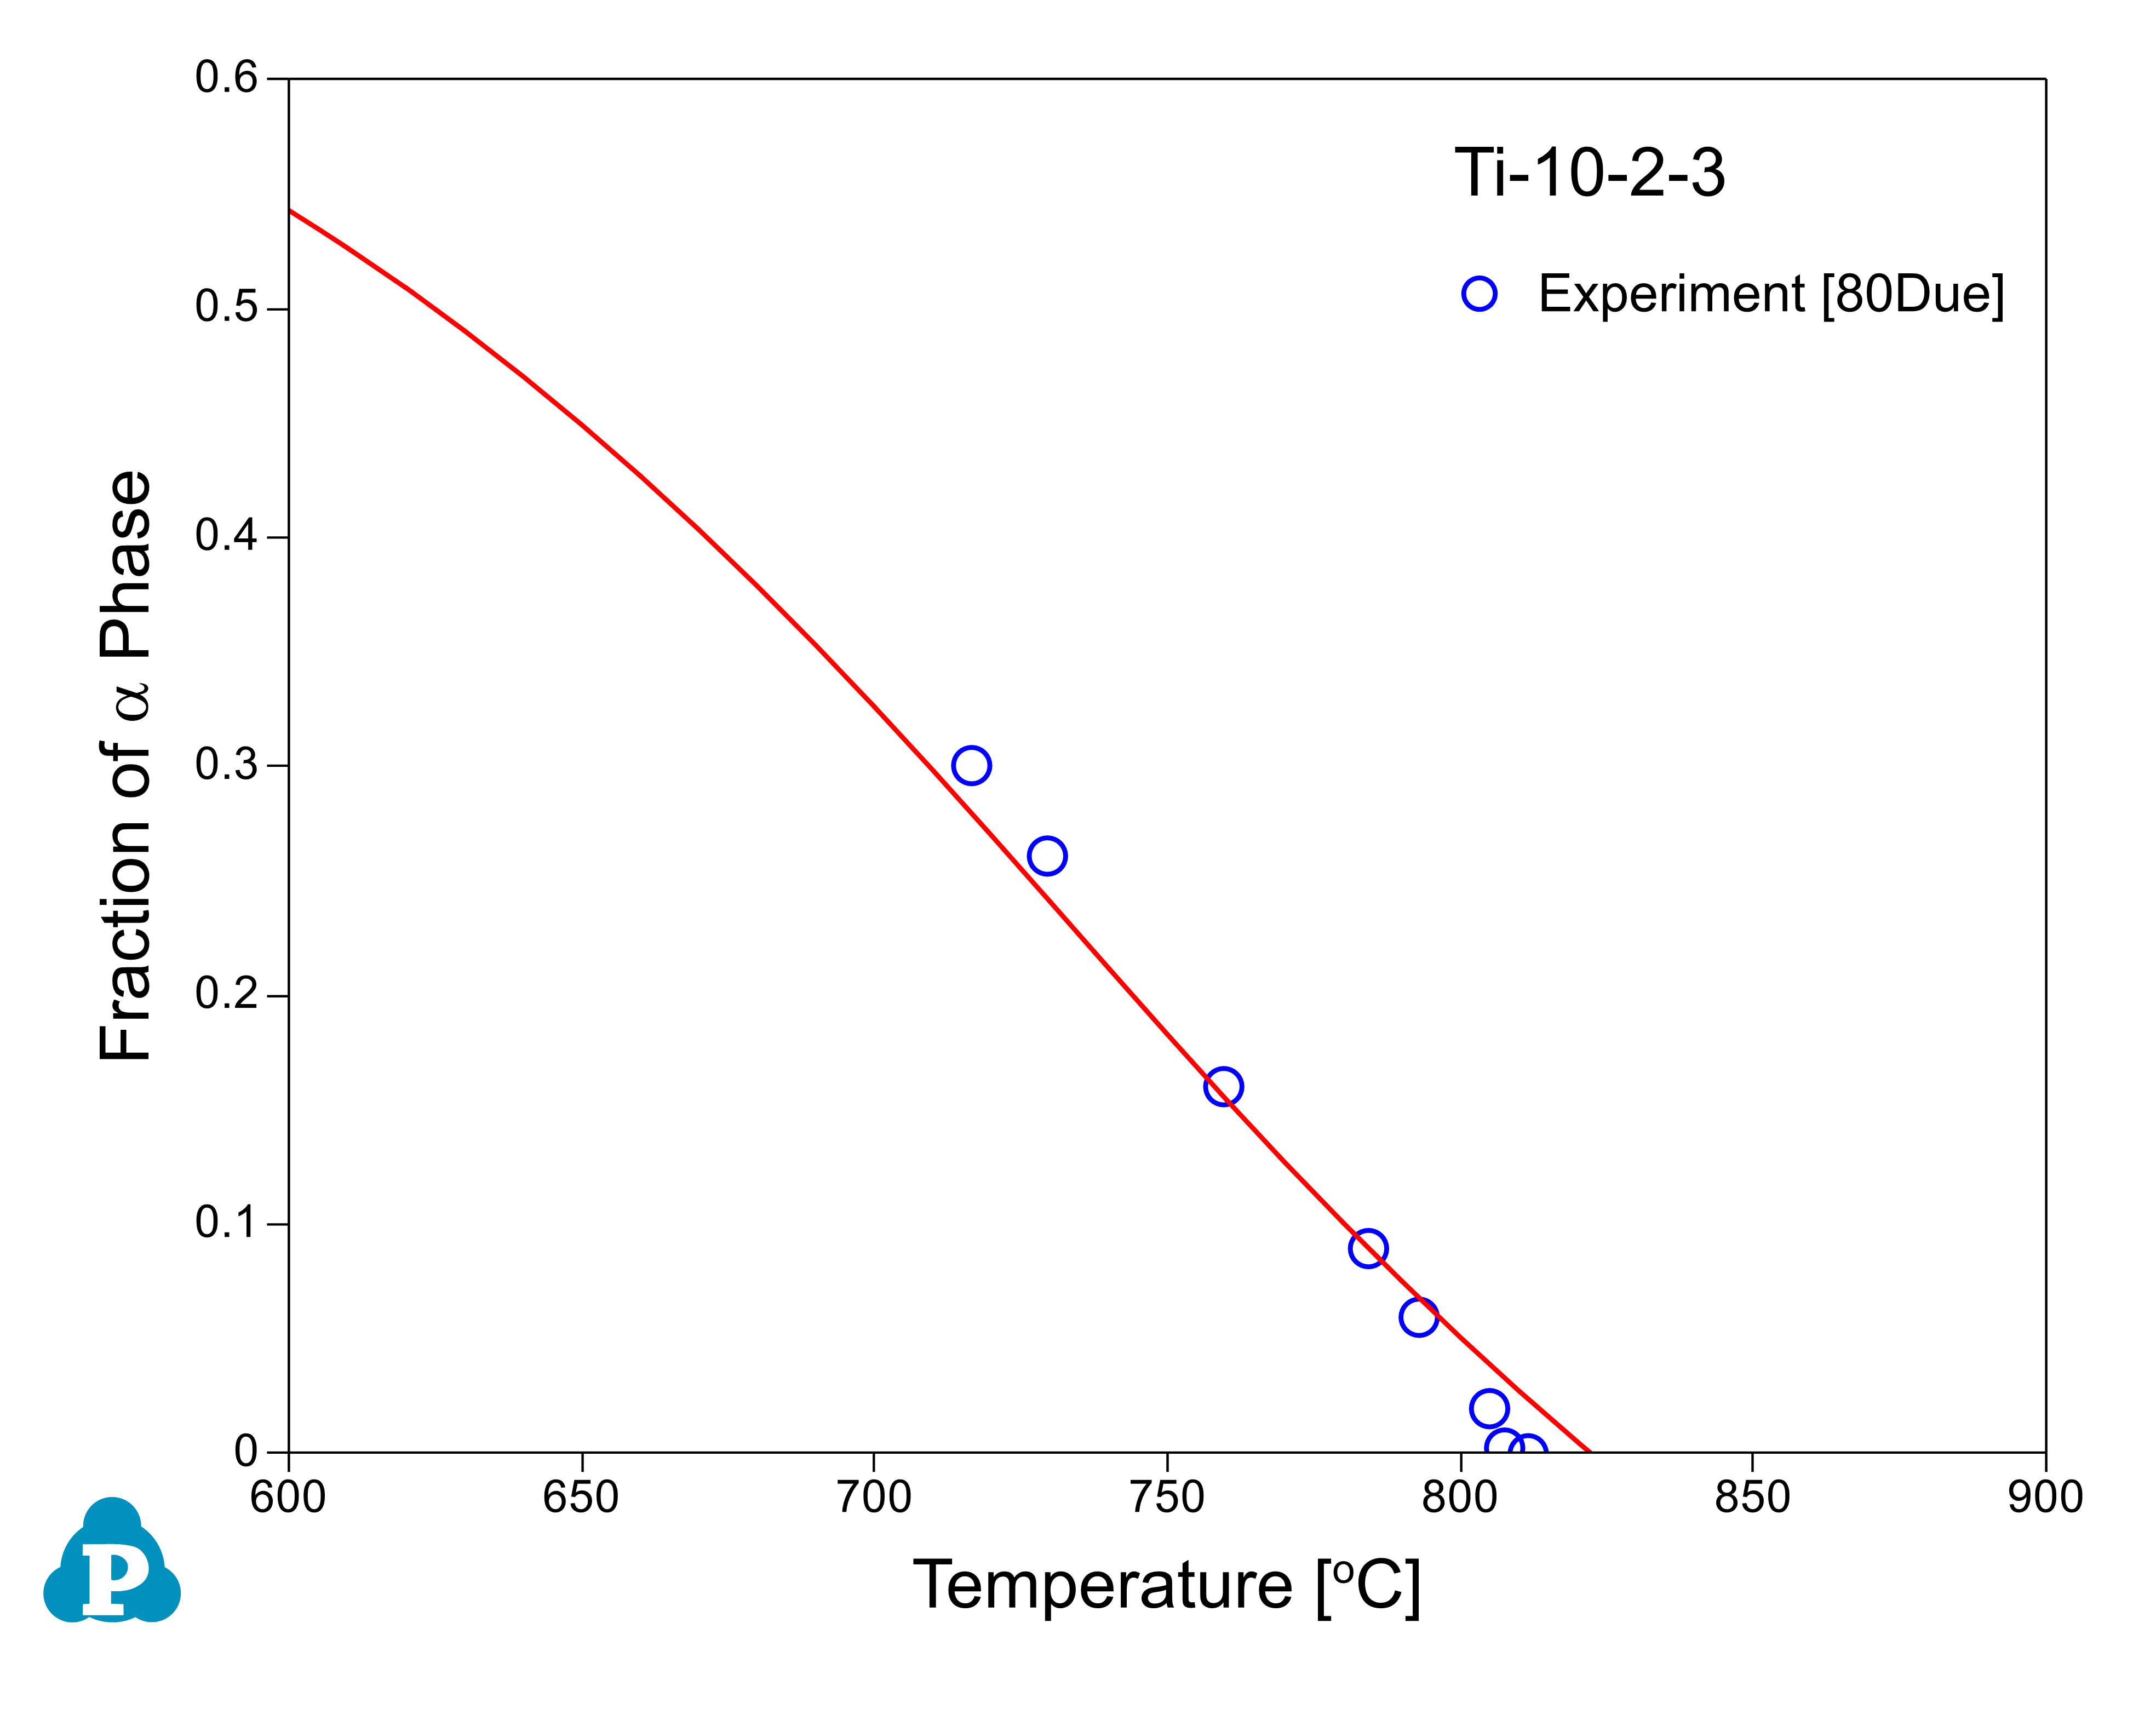
Figure 8 ~ Figure 10 show the calculated fractions of a for IMI550, Corona-X and Ti-10-2-3 alloys, respectively. The calculated results agree with experimental data very well.
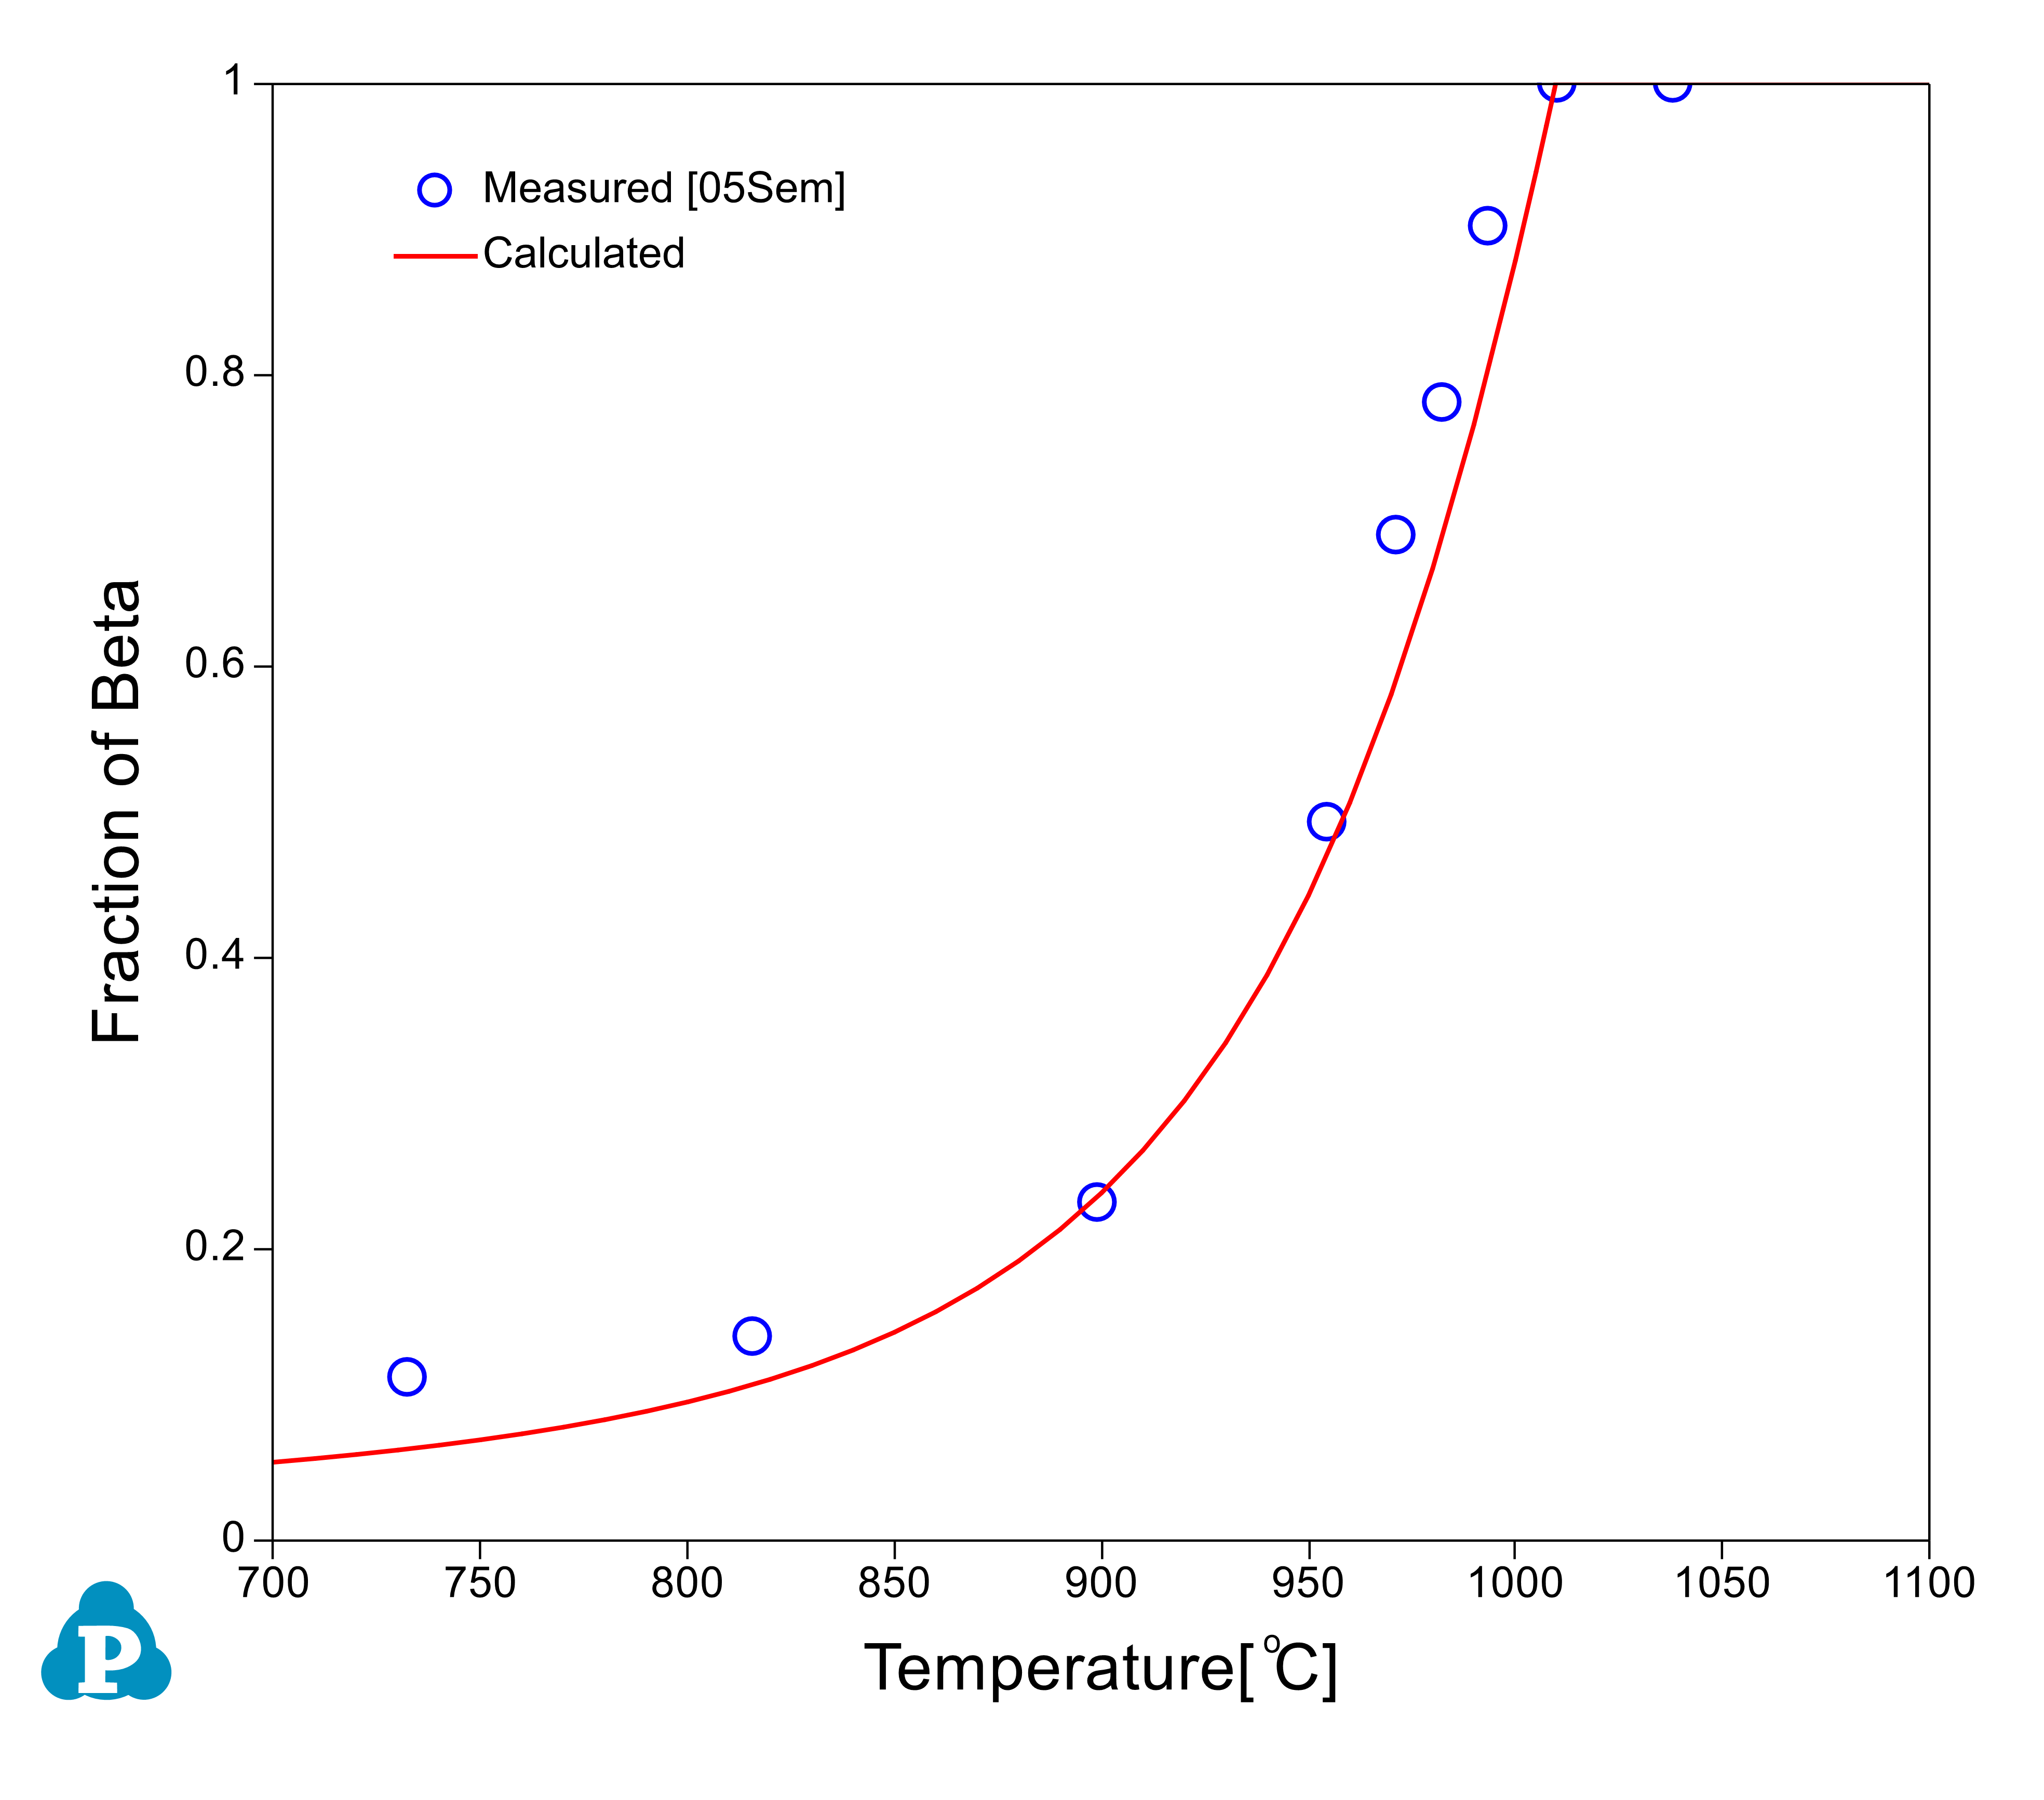
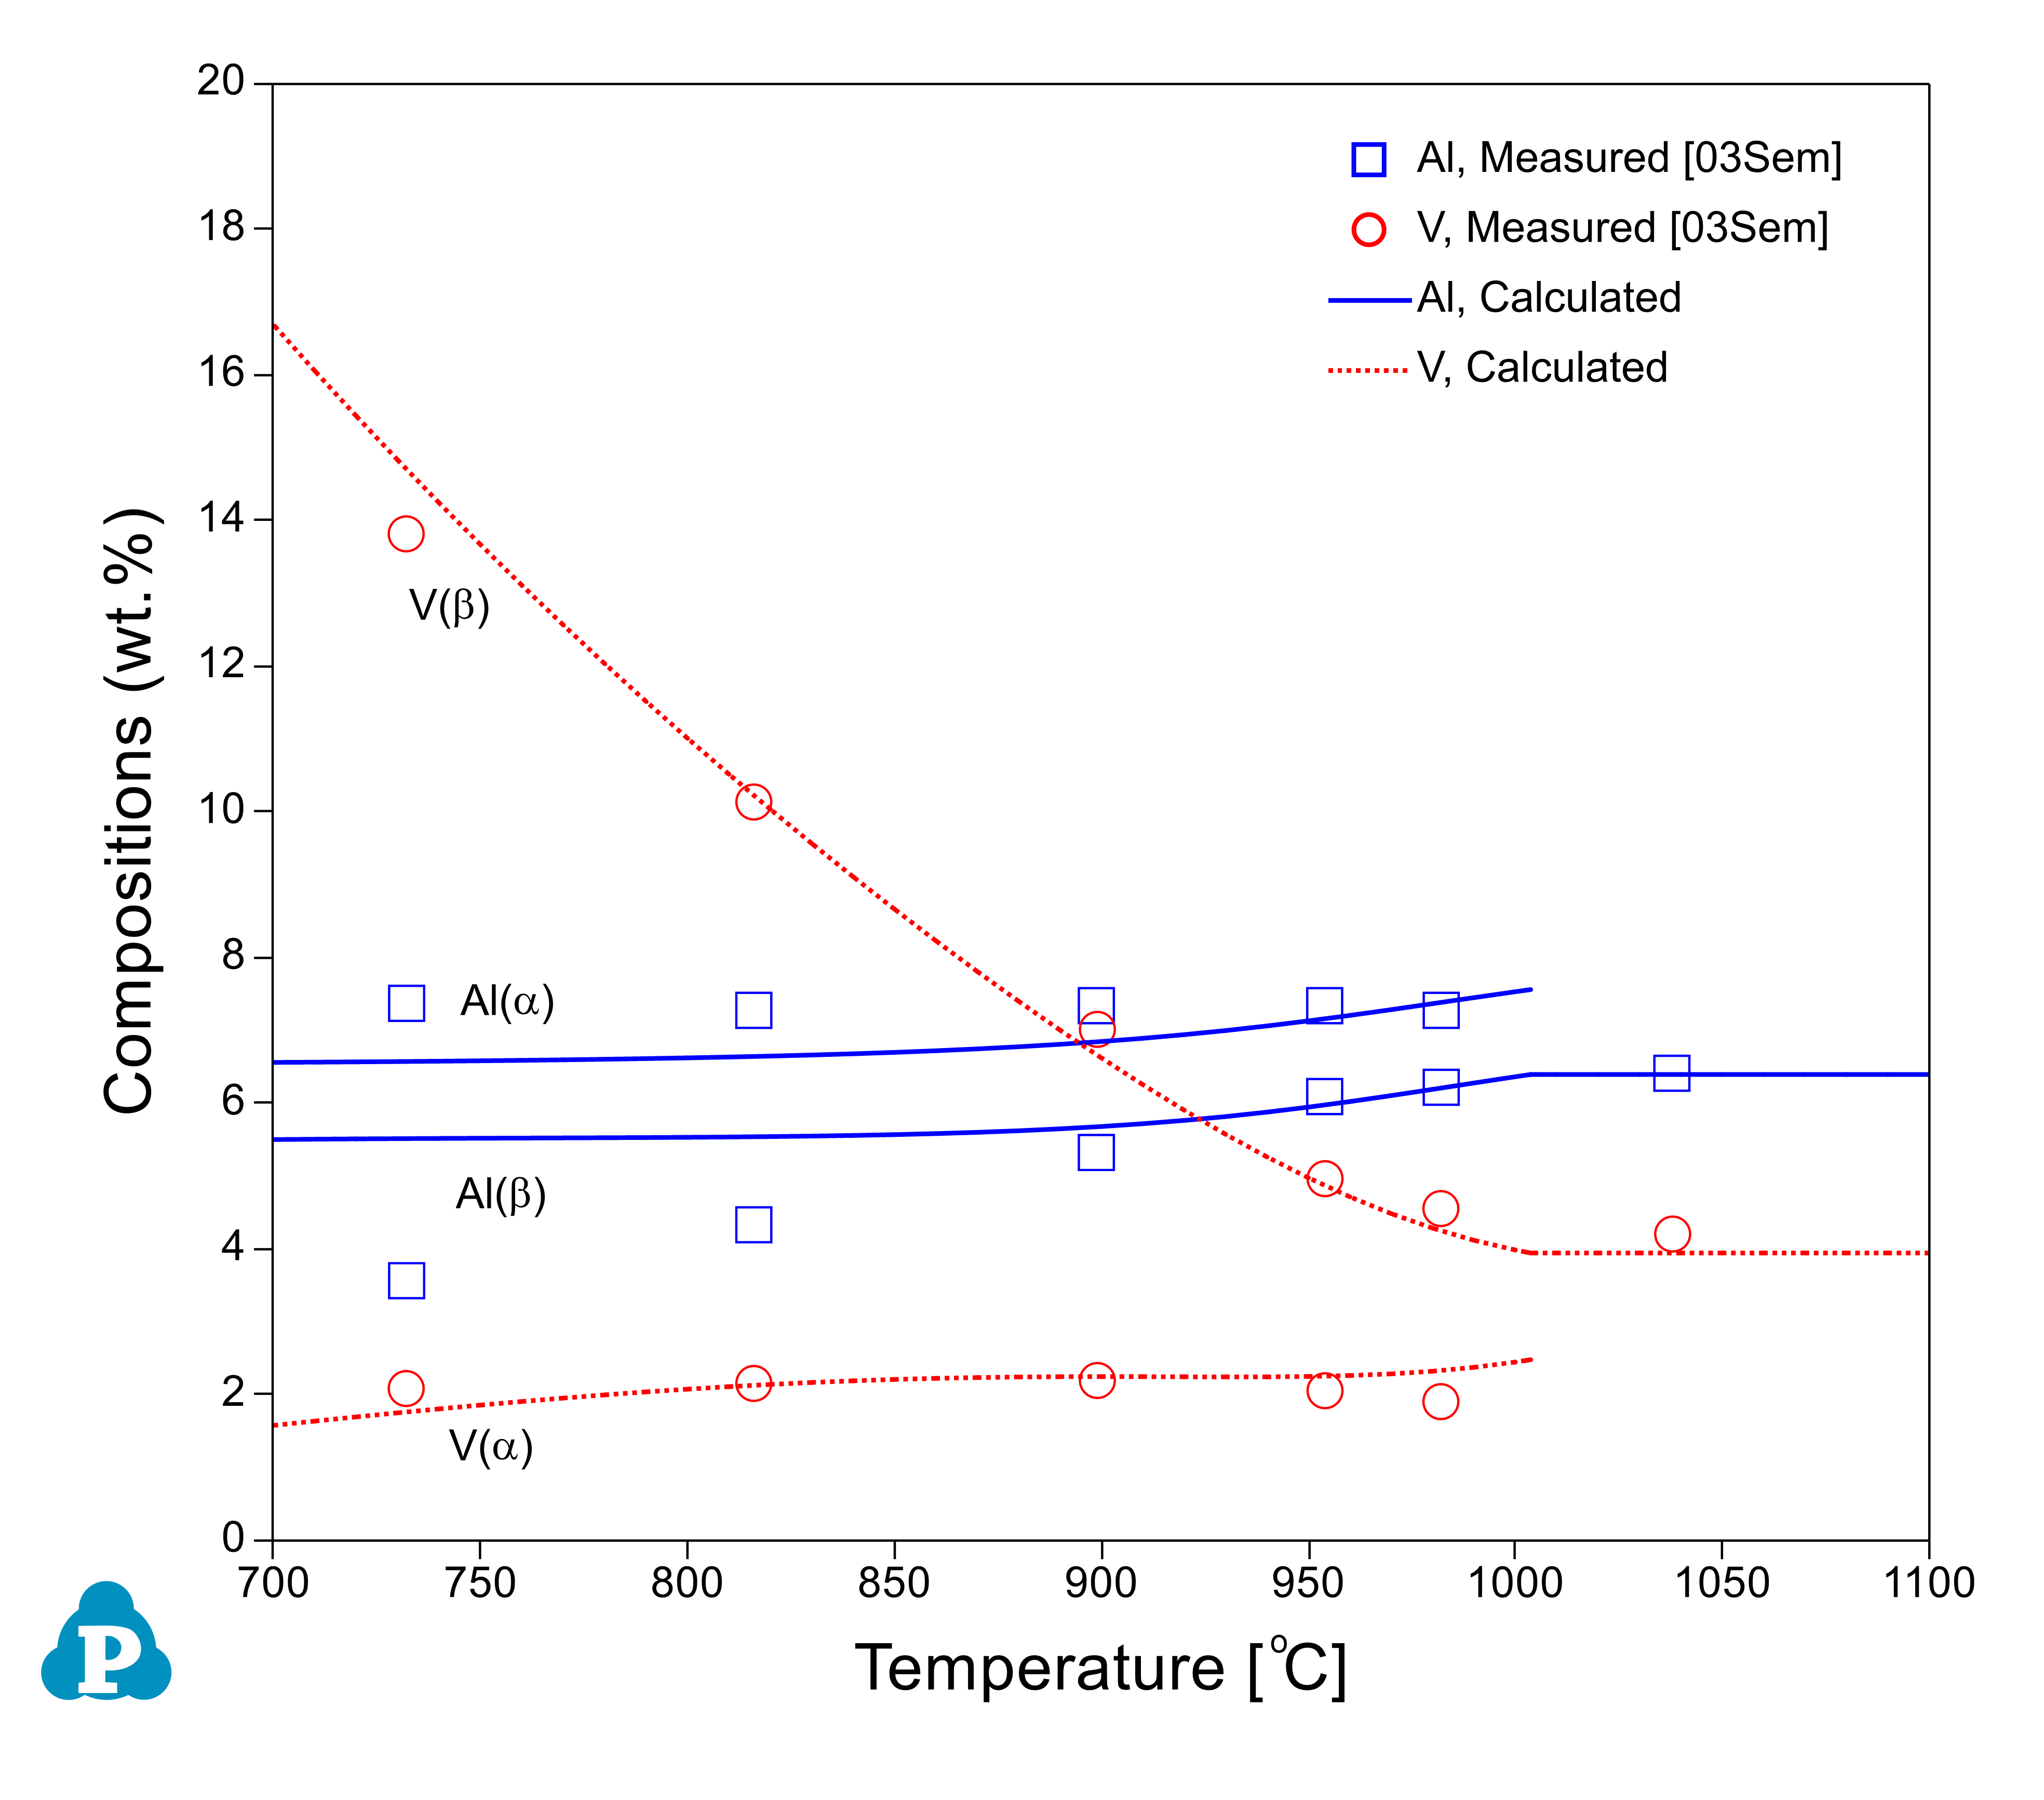
Figure 6: Equilibrium compositions of Al and V in the a and b phases for a Ti64 alloy with the experimental data from [2003Sem]
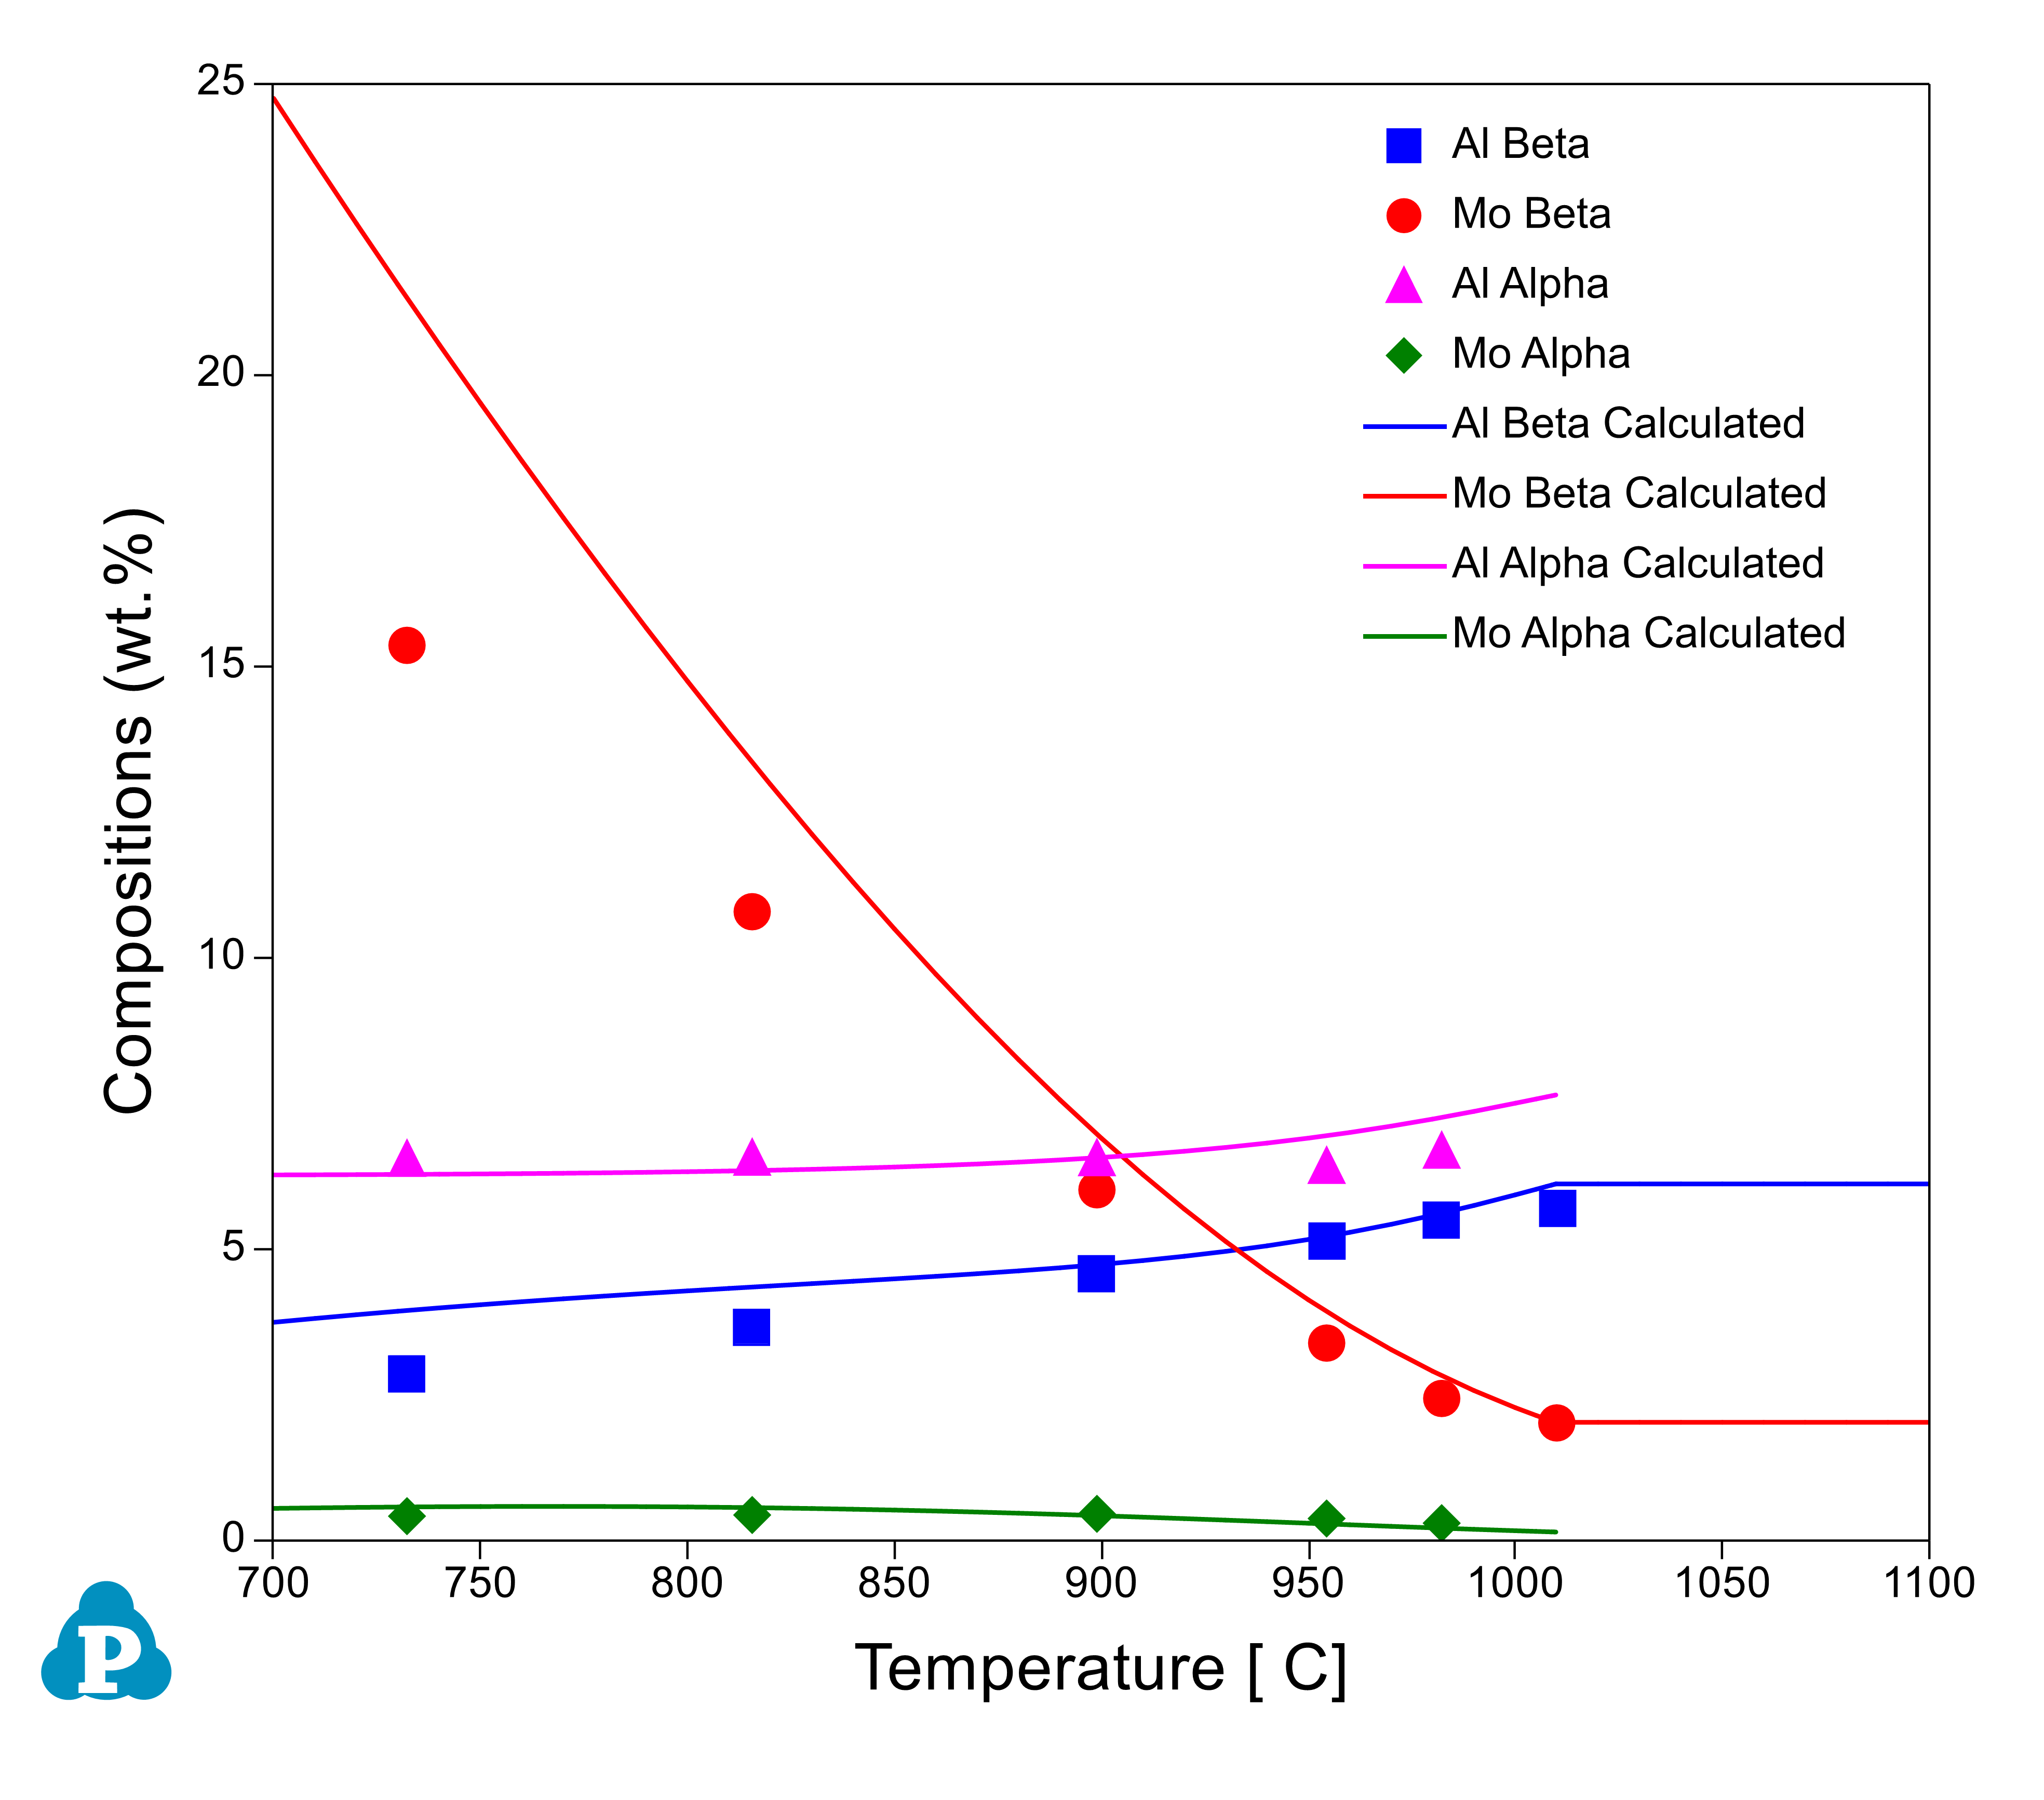
Figure 7: Equilibrium compositions of Al and Mo in the alpha and beta phases for a Ti6242 alloy with the experimental data from [2005Sem]
[1966Cas] R. Castro and L. Seraphin, Mem. Sci. Rev. Met. 63 (1966): 1025-1058.
[1979Las] A.L. Lasalmonie and M.Loubradou, J. Mat. Sci. 14 (1979): 2589-2595.
[1980Due] T.W. Duerig, G.T. Terlinde and J.C. Williams, Met. Trans. A 11A (1980): 1987-1998.
[1984Lin] F. S. Lin, E. A. Starke, Jr., S. B. Chakrabortty and A. Gysler, Met. Trans. 15A (1984): 1229-1246.
[1984Yod] G.R. Yoder, F.H. Froes and D. Eylon, Met. Trans. 15A (1984): 183-197.
[1986Kah] A.I. Kahveci and G.E. Welsch, Scripta Met. 20 (1986): 1287-1290.
[1986Ro] Y. Ro, H. Onodera, and K. Ohno, Trans. Iron Steel Inst. Japan 26(4) (1986): 322-327.
[1991Lee] Y.T. Lee, M. Peters and G. Welsch, Met. Trans. 22A (1991): 709-714.
[1994Boy] R. Boyer, G. Welsch and E. W. Collings, Materials Properties Handbook: Titanium Alloys, ASM International, Materials Park, OH, 1994.
[2001Kha] K.K. Kharia and H.J. Rack, Met. Trans. 32A (2001): 671-679.
[2003Boy] R. Boyer, Boeing, private communication, 2003.
[2003Fur] D. Furrer, LADISH, private communication, 2003.
[2003Sem] S.L. Semiatin, S.L. Knisley, P.N. Fagin, F. Zhang and D.R. Barker, Met. Trans. 34A (2003): 2377-2386.
[2003Ven] V. Venkatesh, TIMET, private communication, 2003.
[2005Sem] S.L. Semiatin, AFRL, private communication, 2005.